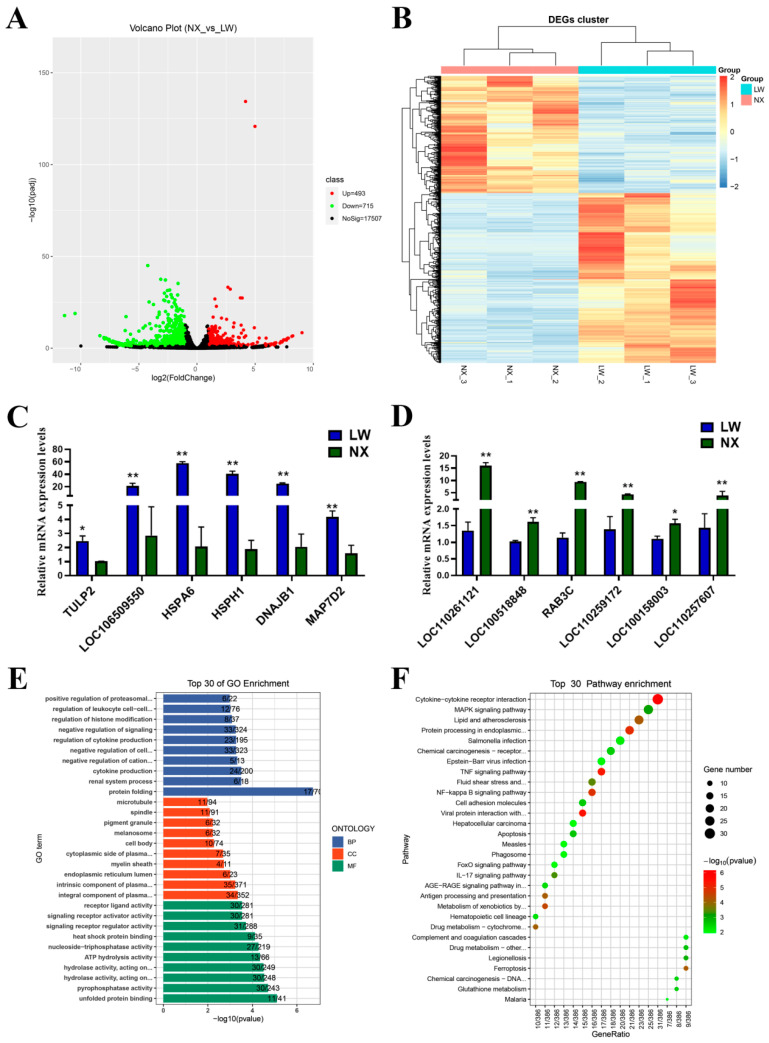
Figure 5.
The description of differentially expressed mRNAs in LW and NX pig skeletal muscles. (A) Volcano plot representation of the differentially expressed mRNA genes. (B) Hierarchical cluster analysis of differentially expressed mRNA genes. (C) qPCR result showing the up-regulated mRNA expressions in LW pigs. (D) qPCR result showing the down-regulated mRNA expressions in LW pigs. (E) Top 30 enriched pathways of differentially expressed genes by GO analysis. (F) Top 30 enriched pathways of differentially expressed genes by KEGG prediction. * p < 0.05, ** p < 0.01.

