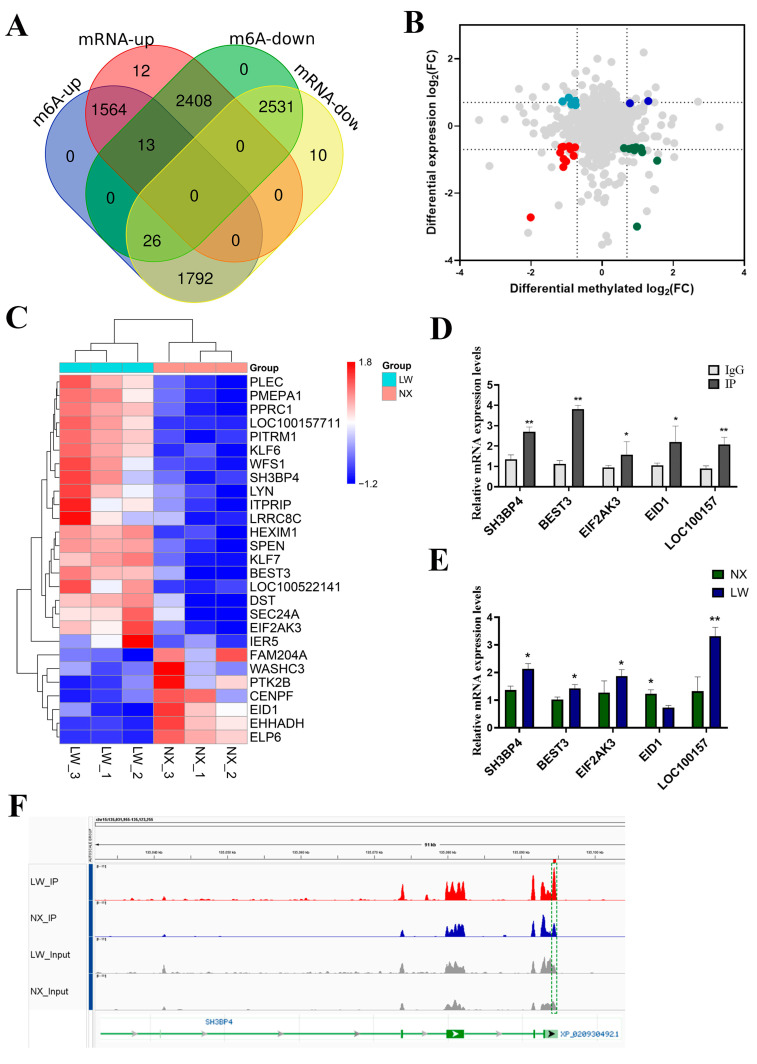
Figure 6.
Integrated analysis of RNA-Seq and MeRIP-Seq. (A) Venn diagram depicting peak numbers with differential m6A methylation and changes in mRNA expression. (B) Four-quadrant plot illustrating the distribution of genes. Different colors indicate different changes in RNA expressions or m6A methylation levels. (C) Heatmap displaying the expression of 27 genes with notable differences in methylation levels. (D) MeRIP-qPCR validation of 5 m6A-methylated genes, using IgG as a negative control. (E) qPCR analysis showing increased expression of 5 hyper-up genes in LW pigs compared with NX pigs. (F) IGV visualisation of RNA-seq (grey) data and MeRIP-seq (red and blue) data at the SH3BP4 gene loci. * p < 0.05, ** p < 0.01.

