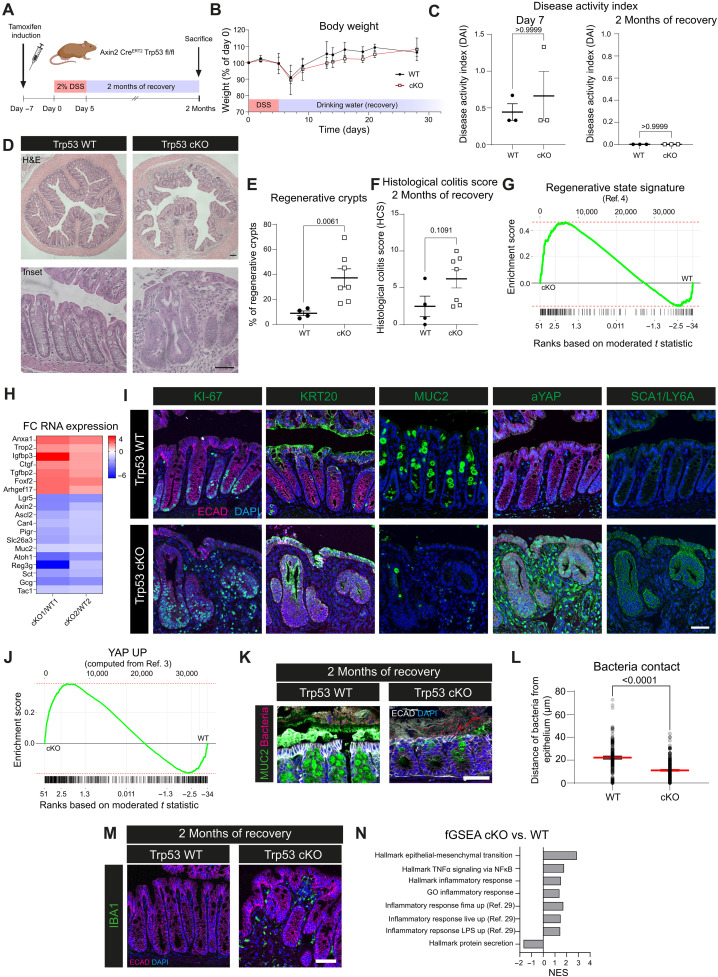
Fig. 2. Loss of Trp53 prevents return to tissue homeostasis after colitis-associated injury and locks the epithelium in a regenerative state.
(A) Schematic: DSS treatment and recovery. (B) Body weight curve. (C) Disease activity index (DAI) for day 7 and 2 months of recovery. (D) Hematoxylin and eosin (H&E) staining for WT and cKO with 2 months of recovery. (E) Quantification of regenerative crypts after 2 months of recovery. (F) Histological colitis score at 2 months recovery. (G) Enrichment plot for the regenerative signature (4) cKO versus WT [false discovery rate (FDR) = 0.015, P = 0.00038, enrichment score (ES) = 0.47, normalized enrichment score (NES) = 2]. (H) Fold change (FC) of RNA expression for regenerative and epithelial lineage markers in cKO versus WT. Results from one WT versus one cKO mouse each. (I) IF of WT and cKO for KI-67, KRT20, MUC2, aYAP, or SCA1/LY6a (green), E-cadherin (magenta), and DAPI (blue). (J) Enrichment plot for a YAP signature based on data from (3) for cKO versus WT (FDR = 0.015, P = 0.00036, ES = 0.38, NES = 1.8). (K) RNA-ISH and IF for bacteria (magenta), MUC2 (green), E-cadherin (white), and DAPI (blue) in WT and cKO mice with 2 months of recovery. (L) Quantification of (K). Median and SEM. (M) IF for IBA1 (green) in WT and cKO mice with 2 months of recovery (E-cadherin, magenta; DAPI, blue). (N) NES for GSEA of Molecular Signatures Database (MSigDB) gene sets of mice with 2 months of recovery. Scale bars, 100 μm [overview in (C)] and 50 μm (others). (B and C) n = 3 mice for WT and cKO. (E, F, and L) n = 2 mice for WT; n = 3 for cKO; data points represent quantification from different colon cross sections. n = 2 mice for WT; n = 3 for cKO for all stainings. n = 2 mice for RNA expression data. TNFα, tumor necrosis factor–α; NF-κB, nuclear factor κB; GO, Gene Ontology; LPS, lipopolysaccharide.

