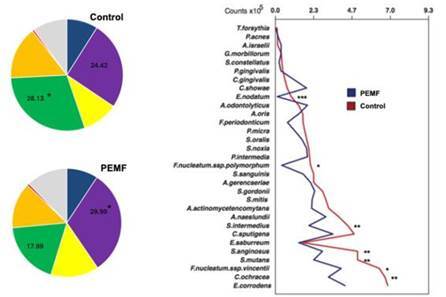
Figure 1. A) Pie charts of the mean proportions of each microbial complex in the In vitro multispecies biofilm. Different colors represent the microbial complexes described by Socransky et al. (1998). The grey color (‘Others’) represents species that did not fall into any complex, and Actinomyces spp. are represented in blue. Significance of differences in mean proportions between groups were tested using the Mann-Whitney U-test (*p>0.05); B) Mean bacterial count (x105) of the bacterial species formed on titanium surfaces of Control group, healing cap without electromagnetic healing cap and Test group, healing cap with electromagnetic healing cap. Data were analyzed using the Mann-Whitney test (* p<0.05; ** p<0.01, *p<0.001). Reproduced with permission (Faveri et al. Biofouling 2021 License Number 5733760205595).

