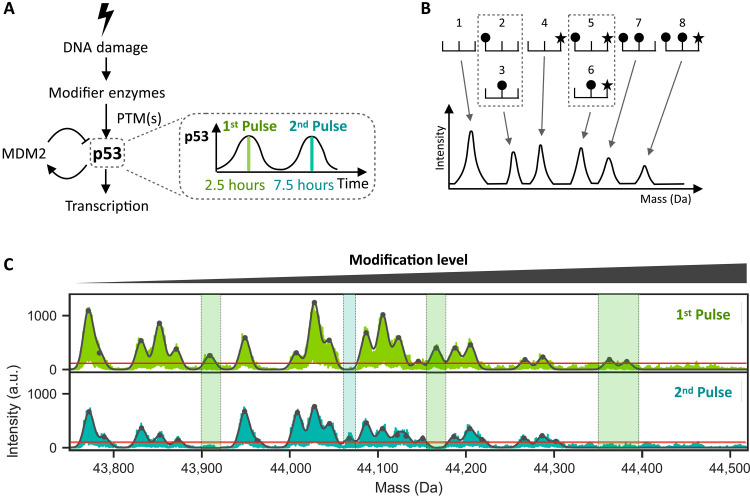
Fig. 1. The overall state of p53 PTMs changes between its first and second pulses following DNA damage.
(A) DNA damage activates enzymes, which activate p53 through PTMs. Activated p53 subsequently transcribes target genes including MDM2, an E3 ubiquitin ligase that leads to p53 degradation. The resulting negative feedback loop leads to oscillatory p53 dynamics with its first peak at 2.5 hours and second peak at 7.5 hours after initial DNA damage. (B) Schematic depicting a protein with 3 sites of modifications (top), the first two sites being subject to one type of modification (circle) and the third site to a different type of modification (star). The eight possible modified forms are shown. An I2MS spectrum (bottom) can distinguish forms that are unique in mass (1, 4, 7, 8) while those sharing the same mass cannot be distinguished (2 and 3, 5 and 6). (C) I2MS mass spectra of p53 proteins isolated at the peaks of the first (top) or second (bottom) pulses as shown in arbitrary units (a.u.). The furthest left peak shows the least modified form of p53, and all peaks to the right represent combinations of p53 PTMs. Black contour line represents fitted Gaussian distributions to each peak in the spectrum, while horizontal red line distinguishes the limit of detection (detailed in Materials and Methods). Shaded green and turquoise areas indicate modification states that differ between the first and second p53 peaks.

