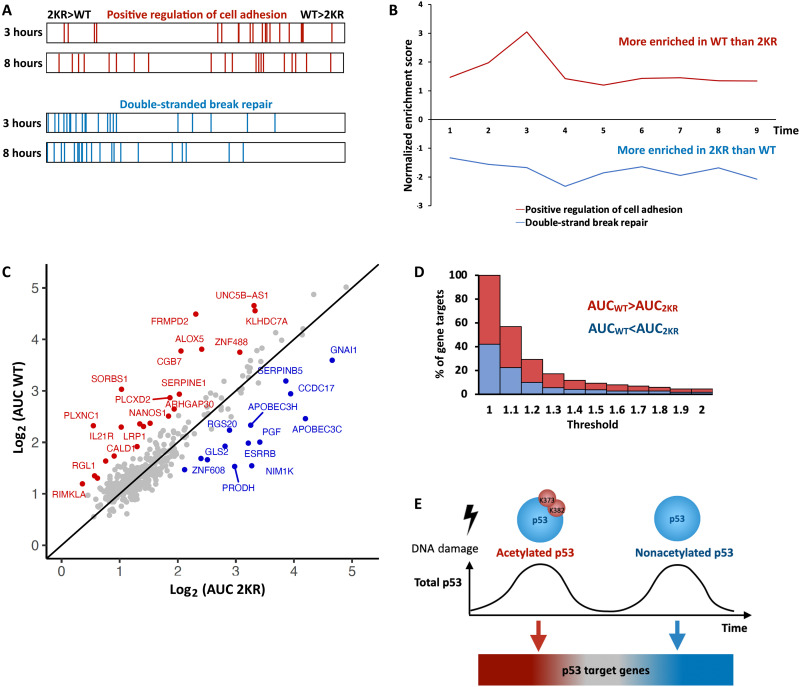
Fig. 4. Pulse-dependent modifications of p53 temporally separate its various transcription programs.
(A) GSEA barcode of “positive regulation of cell adhesion” pathway genes (top) or “DSB DNA repair” pathway genes (bottom) in 2KR compared to WT cells at 3 or 8 hours post irradiation. (B) Normalized Enrichment Score (NES) for the pathways shown in (A) at the indicated time points as calculated by GSEA. Positive values represent enrichment in WT p53, while negative values represent enrichment in 2KR. (C) Scatter plot of the fold-change AUC from 1 to 3 hours for p53 target genes in WT versus 2KR cells. Genes enriched at least 1.5-fold in WT or 2KR are colored red or blue, respectively. (D) Stacked bar-graph showing the percentage of gene targets having a WT:2KR (for WT > 2KR) or 2KR:WT (for WT < 2KR) AUC ratio at or above the indicated threshold. Red bars represent genes enriched in WT cells, and blue bars represent genes enriched in 2KR cells. (E) Model depicting how changes in acetylation on distinct pulses of p53 lead to different transcriptional activation of target genes. Red genes are better induced under K373/K382 acetylated p53. Blue genes are better induced under nonacetylated p53. The shift is gradual with grey genes in the middle having no preference.

