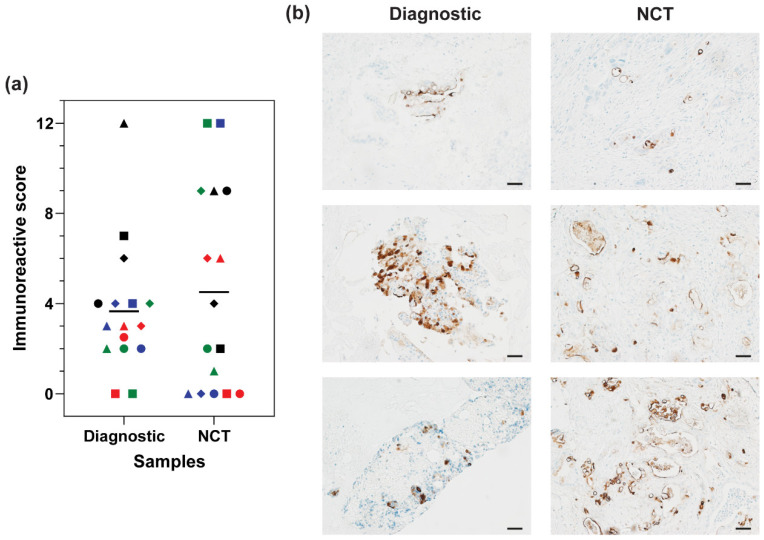
Figure 2.
MUC16 retention in PDAC patient samples after chemotherapy treatment. (a) Distribution of MUC16 stain intensity in matched diagnostic and NCT samples. Matched samples are indicated by the same color and shape. (b) Representative images of the distribution of MUC16 stain intensity in the matched diagnostic and NCT samples. Scale bar = 50 µm.

