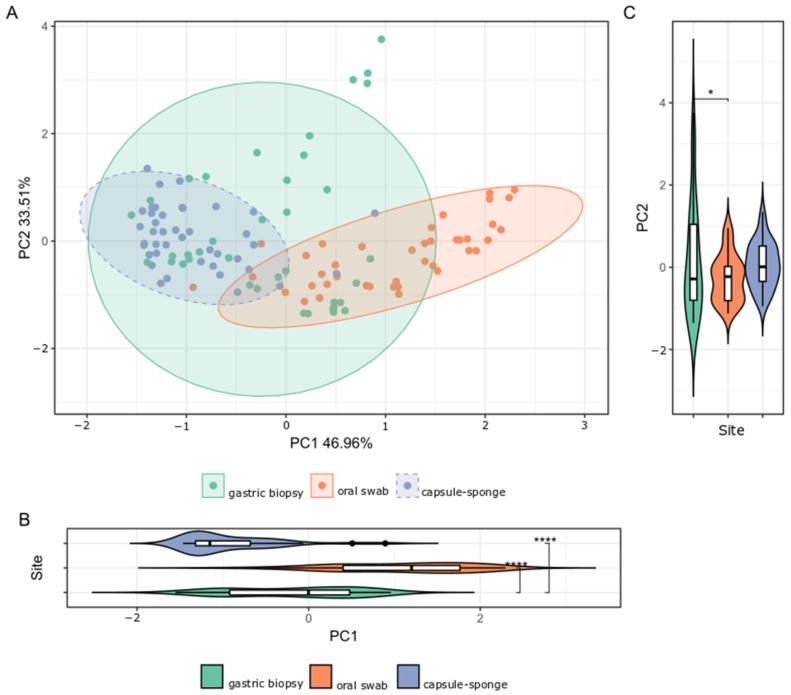
Figure 3.
(A) β-diversity of the bacterial structure comparing the gastric mucosa, capsule-sponge, and oral microbiome population structure of the FD group, as determined by PCoA analysis based on a Bray–Curtis distance measure. (B,C) The separation along PC1 and PC2 indicated specific microbial taxa differentiated the gastric mucosa, capsule-sponge, and oral microbiomes. *: p < 0.05; ****: p < 0.0001.

