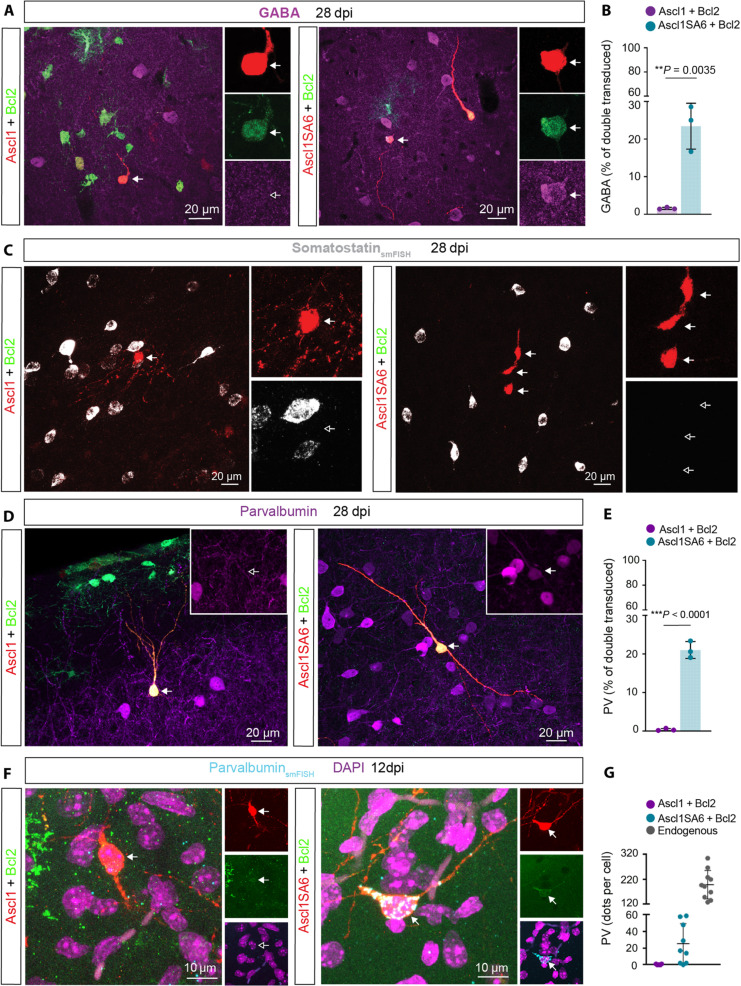
Fig. 3. Forced coexpression of Ascl1SA6 and Bcl2 converts postnatal cortical glia into GABA- and PV-expressing iNs.
(A) Ascl1/Bcl2-transduced cells do not express GABA (left), in contrast to the acquisition of GABA expression in Ascl1SA6/Bcl2 iNs (right), 28 dpi. Arrows indicate iNs lacking GABA (inset, empty arrow) or containing GABA (inset, filled arrow). (B) Proportion of double-transduced cells expressing GABA following Ascl1/Bcl2 or Ascl1SA6/Bcl2 reprogramming at 28 dpi. 1.6 ± 0.3%, 634 cells, n = 3 mice for Ascl1/Bcl2; 23.4 ± 6.1%, 78 cells, n = 3 mice for Ascl1SA6/Bcl2. Data are shown as means ± SD. (C) Ascl1/Bcl2 and Ascl1SA6/Bcl2 iNs lack Sst mRNA. Empty arrows highlight the lack of Sst expression in iNs (insets). (D) Analysis of PV expression in Ascl1/Bcl2-transduced cells (left) and Ascl1SA6/Bcl2 iNs at 28 dpi. Arrows indicate iNs lacking PV (inset, empty arrow) or containing PV (inset, filled arrow). (E) Proportion of double-transduced cells expressing PV at 28 dpi. 0.4 ± 0.3%, 2995 cells, n = 3 mice for Ascl1/Bcl2; 21.0 ± 2.2%, 208 cells, n = 3 mice for Ascl1SA6/Bcl2. Data are shown as means ± SD. (F) Ascl1/Bcl2-transduced cells (left) lack Pvalb mRNA, while Ascl1SA6/Bcl2 iNs (right) express Pvalb mRNA already at 12 dpi. Empty arrows indicate marker-negative cells. (G) Quantification of Pvalb mRNA transcripts expressed as the total number of dots detected per individual cell in Ascl1/Bcl2, Ascl1SA6/Bcl2-transduced cells, and endogenous surrounding PV interneurons. Each dot represents one cell. 7 cells, n = 3 mice for Ascl1/Bcl2; 9 cells, n = 3 mice for Ascl1SA6/Bcl2 cells; 10 cells, n = 3 mice for endogenous neurons. Data are shown as means ± SD. Two-tailed Student’s unpaired t test in (B) and (E).

