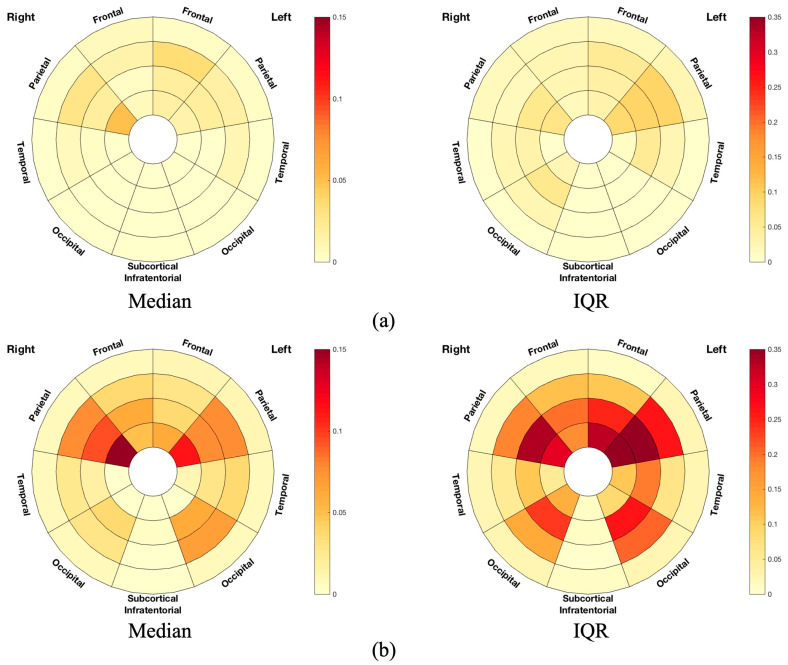
Figure 2.
Frequency plots of lesion volume in terms of median and IQR in (a) MS-no-LUTS and (b) MS-OAB. The frequency plots were drawn as the ratio between number of significant voxels in a given region and volume of this region. The plots are considered radially between the ventricles and the cortical grey matter discretized into four equidistant layers, derived from the solution to the Laplace equation [41]. The colour bars from bottom to top indicate the lesion volume from lowest to highest. IQR: interquartile range. Frontal: frontal lobe; Occipital: occipital lobe; Parietal: parietal lobe; Subcortical Infratentorial: the basal ganglia, thalami, and infratentorial regions from both sides; Temporal: temporal lobe.

