Figure 5.
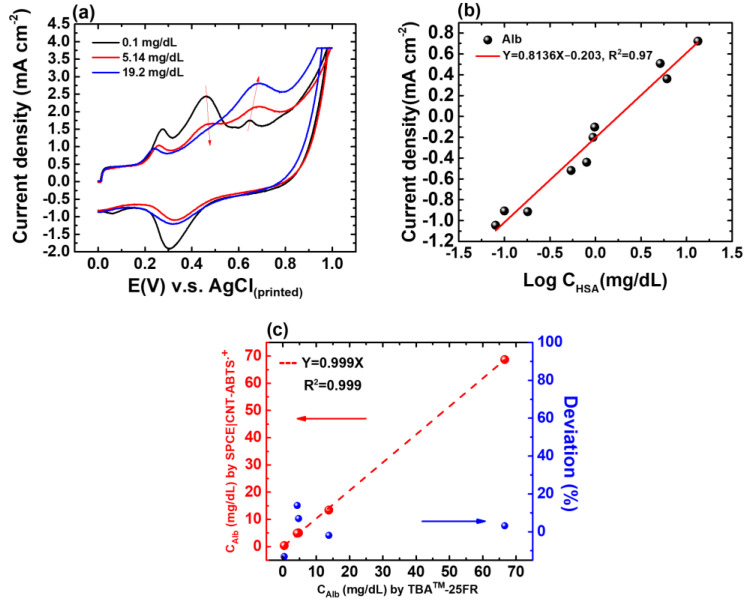
(a) CV responses of the SPE(W1)|CNT-ABTS(CV) to Alb of various concentrations. (b) Calibration curve of the proposed albumin sensor in urine with known concentrations of 0.08, 0.1, 0.18, 0.54, 0.8, 0.94, 0.98, 5.14, 6.1, and 19.2 mg/dL, respectively. (c) Regression analysis of CAlb in five urine samples determined using TBA-25FR and the SPE(W1)|CNT-ABTS(CV) electrode is shown in red; The deviation percentage in the CAlb values determined by TBA™-25FR and SPE(W1)|CNT-ABTS(CV) electrode is shown in blue.

