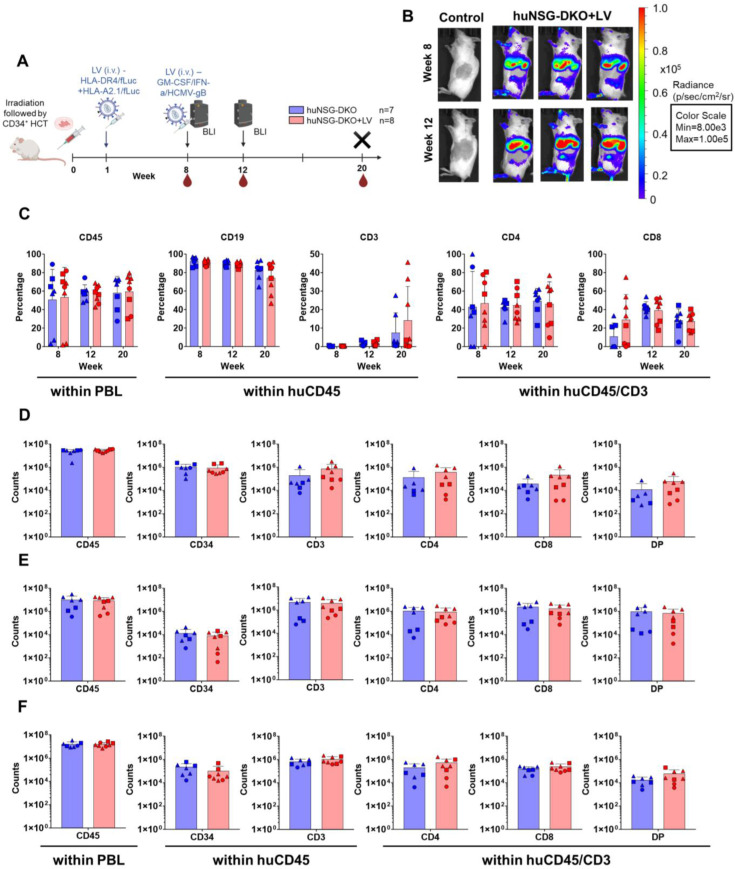
Figure 2.
Human hematopoietic engraftment and T-cell development in humanized NSG-DKO mice. (A) Scheme of experiments: CD34+ stem-cell transplantation (HCT) i.v. after irradiation, lentivirus (LV) immunization i.v., bioluminescence imaging (BLI) analyses, blood collections (BL), and termination (X). Created in BioRender. Lab, S. (2024) BioRender.com/y83d419; (B) full-body BLI quantified as photons/second (p/s) at 8 or 12 weeks post-HCT of huNSG-DKO control (representative of one mouse) or after LV administration (representative of three mice). (C) Blood analyses at weeks 8, 12, and 20 after HCT and longitudinal quantification of cells expressing huCD45, huCD19, huCD3, huCD4, and huCD8 (in percentages). (D) Bone marrow analyses showing the quantification of cells expressing huCD45, huCD34, huCD3, huCD4, huCD8, and DP (in absolute cell counts, log scale). (E) Thymus analyses and quantification of cells expressing huCD45, huCD34, huCD3, huCD4, huCD8, and DP (in absolute cell counts, log scale). (F) Spleen analyses and quantification of cells expressing huCD45, huCD34, huCD3, huCD4, huCD8, and DP (in absolute cell counts, log scale).

