Figure 4.
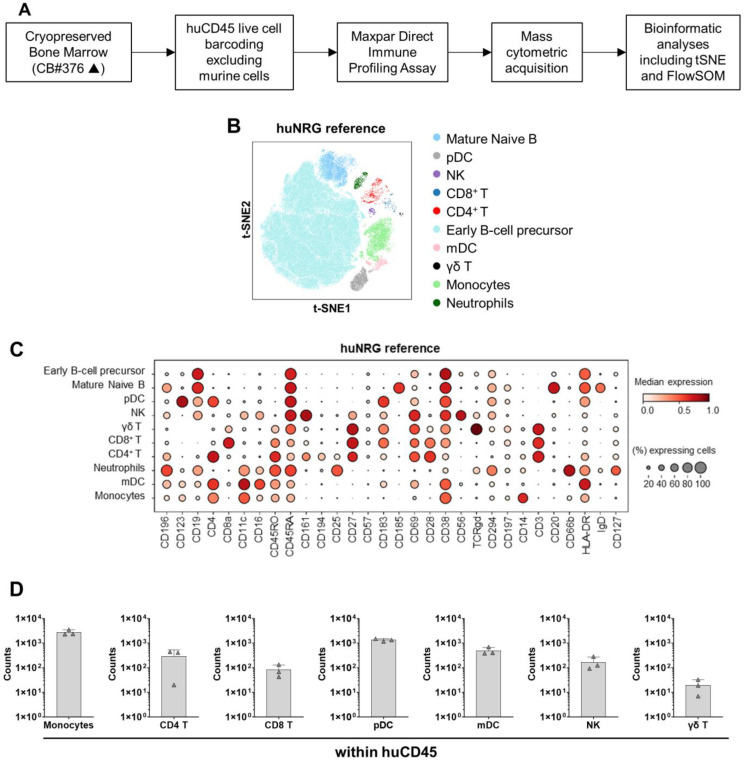
CyTOF analysis of huNRG mice as a reference. (A) Scheme of sample preparation, staining, CyTOF measurement, and analysis of bone marrow samples. The mice were humanized using only one donor (CB #376). (B) Anti-human CD45-CD live cell barcoded analysis of immune cell types in bone marrow samples 20 weeks post-HCT. A total of 152,755 cells were analyzed for huNRG mice. t-SNE plots displaying different subtypes of human immune cells clustered using FlowSOM and annotated manually using the lineage markers presented in the dot plot below. (C) Dotplot of huNRG cell subtypes and their expression of different Maxpar Direct Immune Profiling lineage markers. The dot size corresponds to the fraction of cells expressing the indicated marker within each cell type, and the color indicates the median expression. (D) CyTOF analysis of monocytes, CD4+, CD8+, and γδ T-cells, and natural killer, myeloid, and plasmacytoid dendritic cell counts in bone marrow samples (in absolute cell numbers, log scale).

