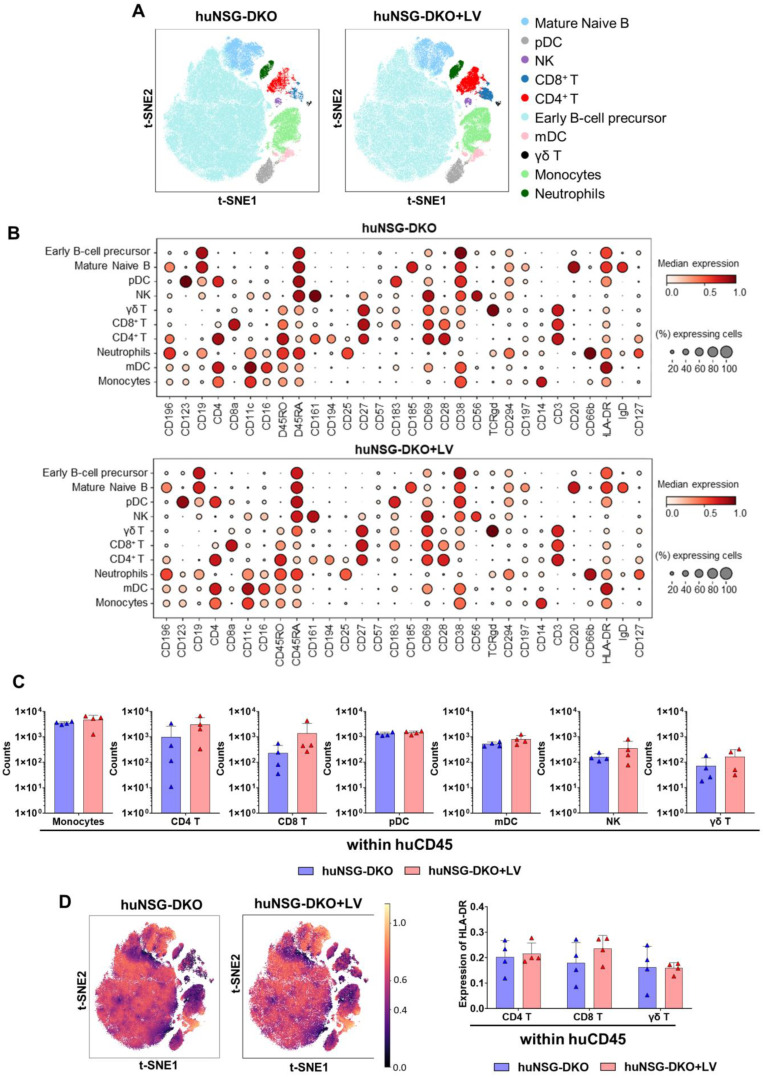
Figure 5.
CyTOF analysis of huNSG-DKO mice. LV delivery promotes T-cell reactivity in humanized NSG-DKO mice. (A) Anti-human CD45-CD live cell barcoded analysis of immune cell types in bone marrow samples 20 weeks post-HCT. A total of 185,888 cells and 160,343 cells were analyzed for huNSG-DKO and huNSG-DKO+LV, respectively. t-SNE plots displaying different subtypes of human immune cells clustered using FlowSOM and annotated manually using the lineage markers presented in the dot plot (panels below). (B) Dotplot of huNSG-DKO and huNSG-DKO+LV cell subtypes and their expression of different Maxpar Direct Immune Profiling lineage markers. The dot size corresponds to the fraction of cells expressing the indicated marker within each cell type, and the color indicates the median expression. (C) CyTOF analysis of CD4+, CD8+, and γδ T-cells and natural killer, monocytes, myeloid, and plasmacytoid dendritic cell counts in bone marrow samples (in absolute cell numbers, log scale). (D) On right side: overlay of HLA-DR expression on t-SNE embeddings of huNSG-DKO and huNSG-DKO+LV across various cell types, as depicted in panel A. On left side: HLA-DR expression in CD4+, CD8+, and γδ T-cells (in absolute numbers).

