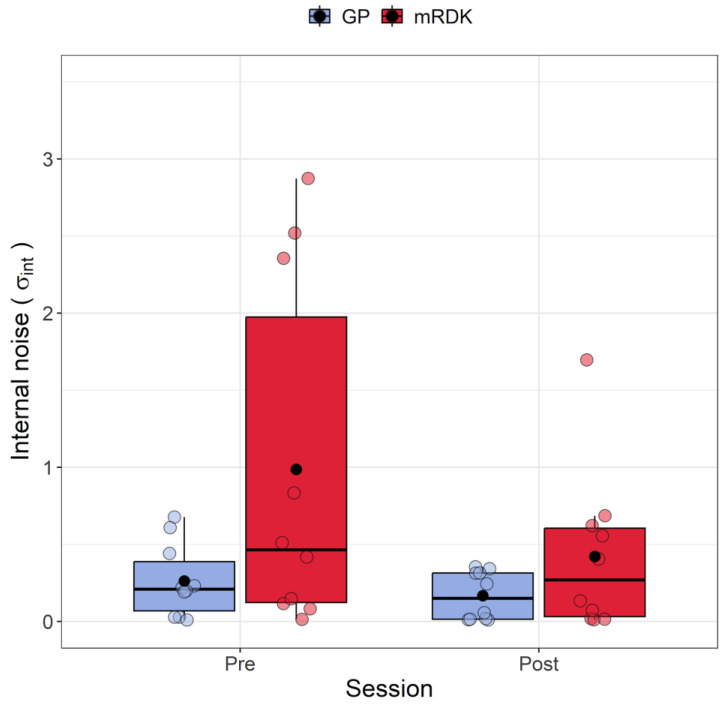
Figure 5.
Boxplots of internal noise () for pre- and post-test conditions. For each boxplot, the horizontal black line indicates the median, whereas the dot within each box represents the mean internal noise (in radians) for each condition. The colored dots represent individual data points, with blue indicating dynamic GPs and red indicating mRDK.

