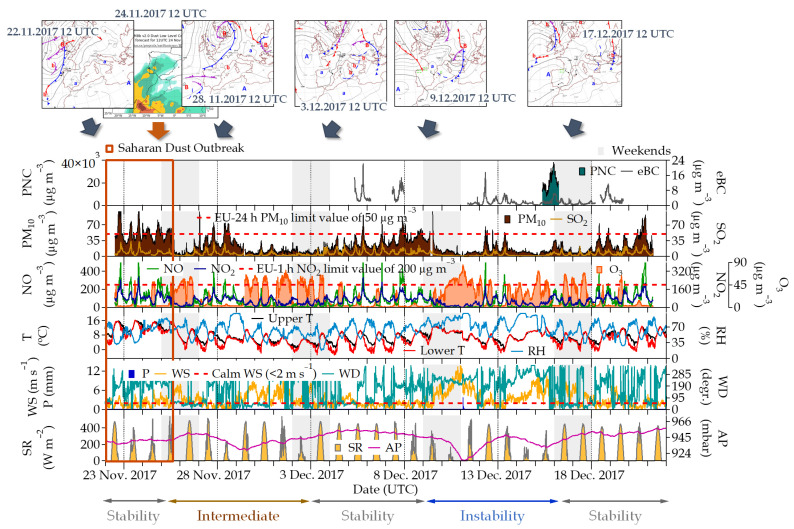
Figure 2.
Temporal evolution of PNC, eBC, PM10, and trace gases (SO2, NO, NO2, and O3) obtained at the external checkpoint and meteorology information (upper and lower temperature (upper and lower T, respectively), relative humidity (RH), wind speed and direction (WS and WD, respectively), precipitation (P), solar radiation (SR), and atmospheric pressure (AP)) obtained at the CIEMAT site during the period of monitoring. In the graph, “Stability” refers to atmospheric stability periods, “Intermediate” to intermediate atmospheric periods, and “Instability” to atmospheric instability periods. The main surface pressure analysis maps and dust load maps describing the different atmospheric periods identified in this study are incorporated on top of the figure.

