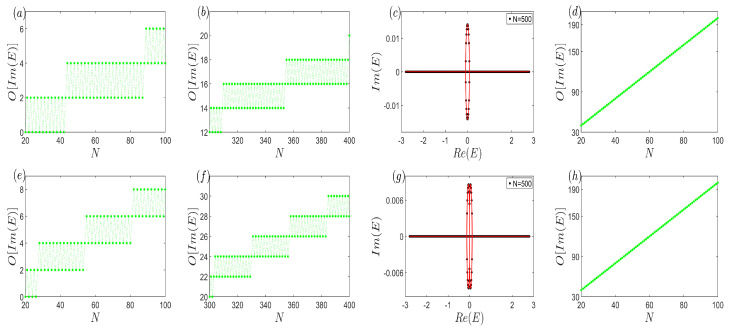
Figure 7.
(Color online) Schematic representation of anomalous open-boundary spectrum. (a,b) The number of the non-zero imaginary part of the open-boundary eigenvalues versus the system size, which displays the oscillation behavior. (c) The open-boundary eigenvalues and the corresponding continuum bands. From (a–c) . (d) The number of the non-zero imaginary part of the open-boundary eigenvalues versus the system size, which increases fleetly and increasingly with . (e,f) The number of the non-zero imaginary part of the open-boundary eigenvalues versus the system size, which exhibits the oscillation behavior as well. (g) The open-boundary eigenvalues and the corresponding continuum bands. From (e–g) . (h) The number of the non-zero imaginary part of the open-boundary eigenvalues versus the system size, which also increases fleetly and increasingly with . The common parameters are , , and .

