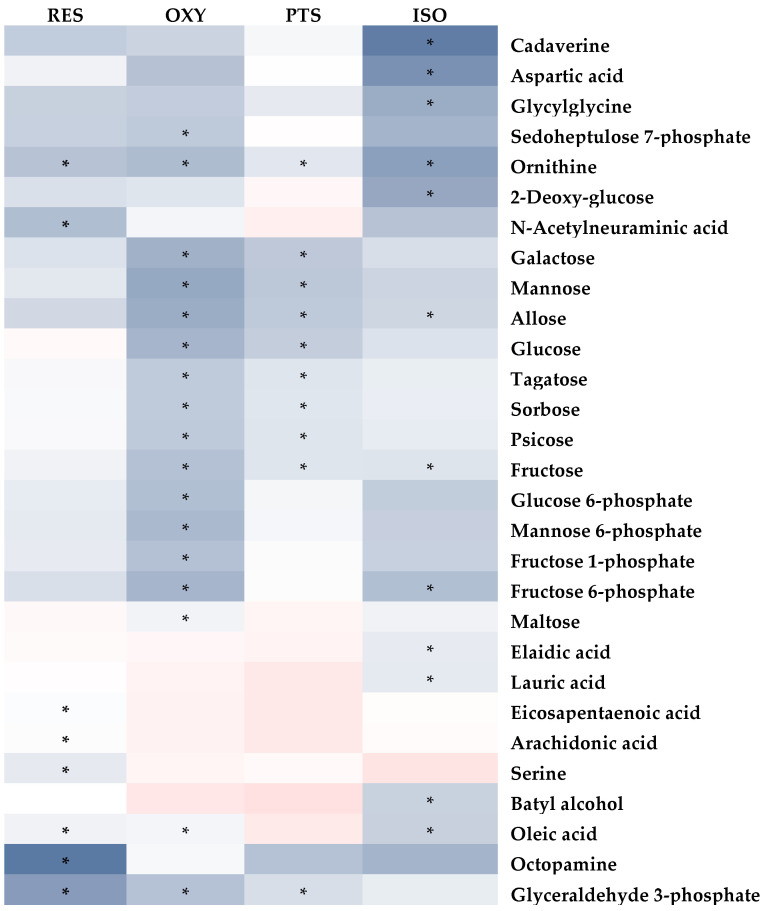
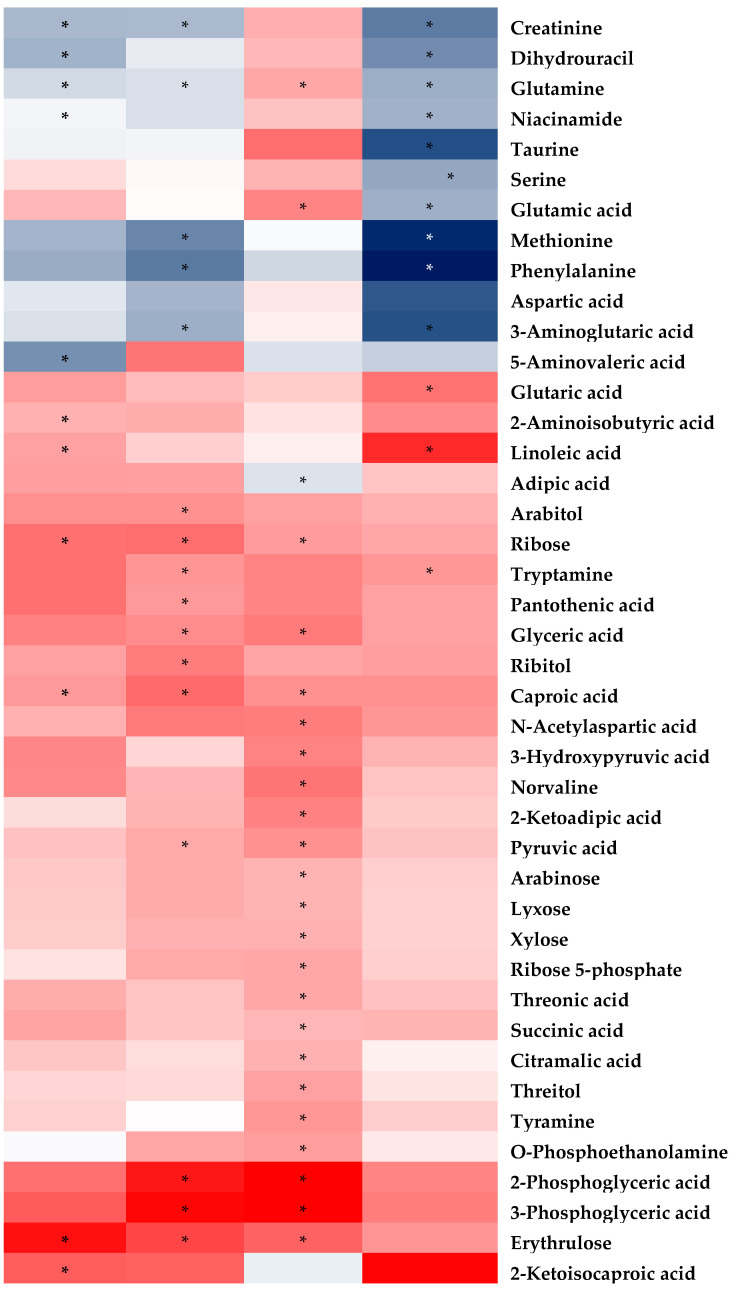
Figure 10.
Fold-change heatmap of brain metabolites after subjecting fold changes to log 2 transformation and hierarchical clustering via Euclidean distance (blue, white and red colors represent negative, no and positive fold change, respectively; the darkness of the color represents the degree of fold change). * Altered endogenous metabolites that were statistically significant (VIP > 1 and FDR < 0.05).


