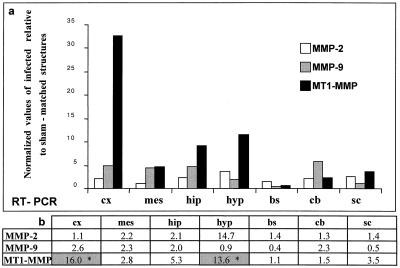
FIG. 4.
MMP-2, MMP-9, and MT1-MMP mRNA expression analyzed by RT-PCR and densitometry. Total RNAs (0.5 μg) extracted from microdissected brain structures from infected and sham-inoculated mice were subjected to RT-PCR. After electrophoresis on an agarose gel and electrotransfer, Southern blotting of the amplicons was performed. Hybridization of specific internal radiolabeled probes allowed the semiquantification of each PCR product. MMP expression was then analyzed by phosphorimaging densitometry. (a) The relative mRNA content for each amplicon was calculated as a fraction of the levels of the housekeeping gene G3PDH mRNA (normalized values), and the results were expressed as a ratio of levels in infected mice relative to those in sham-inoculated mice (relative units). Only slight MMP-2 and MMP-9 upregulation was seen in brain structures of CDV-infected mice, the difference not being significant in the Mann-Whitney test (b). In contrast, marked upregulation of MT1-MMP was seen in infected mice, mainly in the rostral brain (cortex, hippocampus, and hypothalamus), the difference being statistically significant in the cortex and hypothalamus (P < 0.05, indicated by asterisks in the shaded columns). cx, cortex; mes, mesencephalon; hip, hippocampus; hyp, hypothalamus; bs, brain stem; cb, cerebellum; sc, spinal cord.

