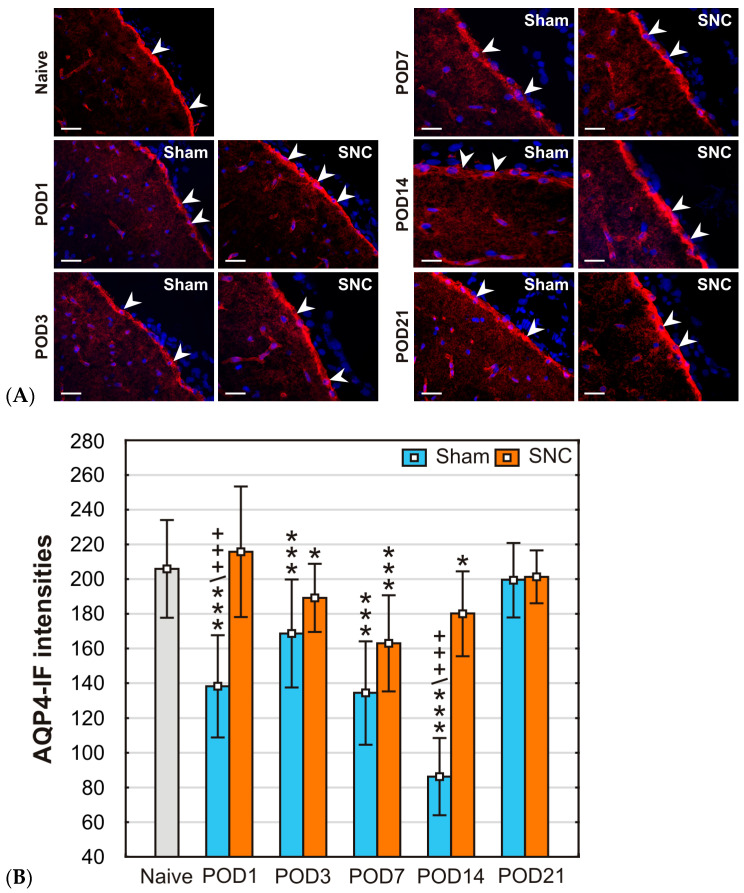
Figure 3.
(A) Representative pictures illustrate AQP4-IF in the GLS of the mPFC from a naïve rat and after sham or SNC operations. Arrowheads indicate GLS position. Scale bars = 100 μm. (B) The dynamics of AQP4-IF intensities in subpial astrocytes following various survival periods after sham and SNC operations. Results are expressed as mean ± SD. *** p < 0.001 vs naïve animals; * p < 0.05 compared to naïve animals; +++ p < 0.001 compared to SNC, (n = 3, for each group).

