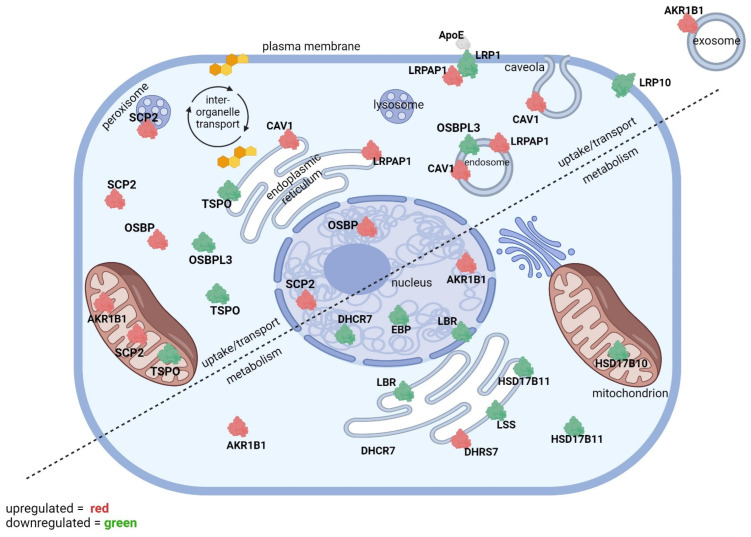
Figure 2.
The effect of αT and γT exposure on the expression of proteins involved in sterol uptake/transport and metabolism. Upregulated (red) and downregulated proteins from Tables 2, 4 and 6 are displayed in a diagram of an RPE cell. The diagram is divided into two segments—proteins involved in sterol uptake and transport (top and left) and proteins involved in sterol metabolism (bottom and right). Subcellular localizations for differentially expressed proteins are included.

