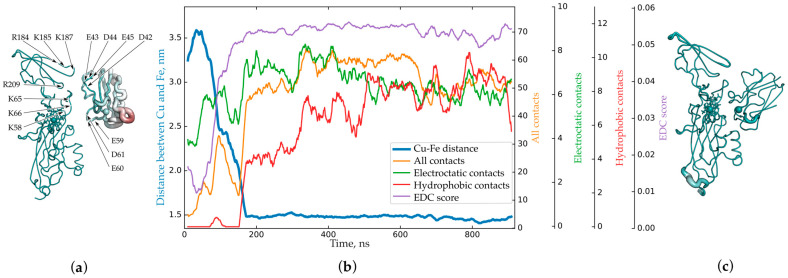
Figure 3.
(a) Central structure of the first cluster of encounter complexes of Pc and Cyt f from higher plants with electrostatic energy of more than 8 kT [8]. (b) Dependence of the number of hydrophobic (red), electrostatic (green), and all (orange) contacts and EDC score (lilac) on time in comparison with the change in distance (blue) between iron and copper atoms obtained from MD calculations, based on data from [21] and current research (EDC score). (c) Structure of the final complex obtained from MD calculations. Structures are colored according to the value of the B-factor from emerald (0) to ruby, 7263 A2 in (a) and 2074 A2 in (c). The thickness of the lines of protein structures is proportional to the value of the B-factor. Panels (a,c) are reprinted from [8] with permission from John Wiley & Sons, Inc. © 2019 Scandinavian Plant Physiology Society.

