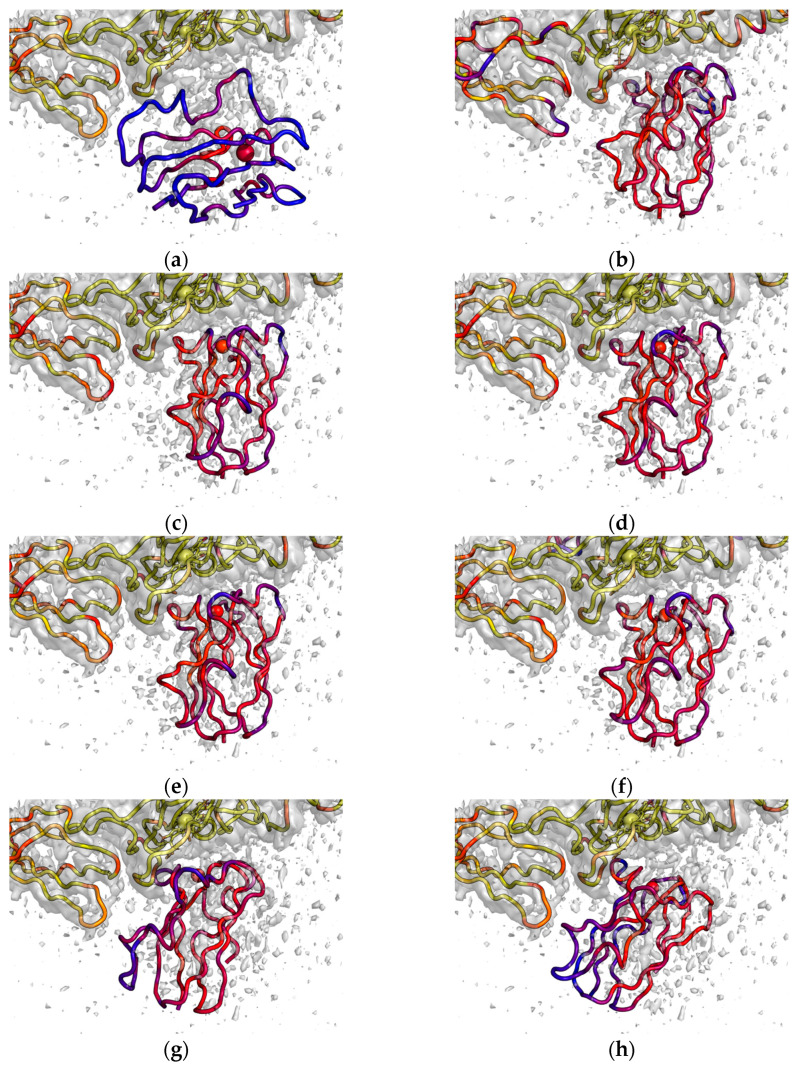
Figure 4.
Backbone structure of Pc–Cyt f complexes aligned to Cyt f of Cyt bf complex (PDB id 7qrm [13]) superimposed on the electron density obtained by cryo-EM (EMDB entry EMD-14123 [13]). (a) Central structure of encounter complexes cluster obtained by BD for spinach Pc and turnip Cyt f. (b) Final complex obtained by all-atom MD, initiated from the structure in panel (a). (c) Complex of spinach Pc and turnip Cyt f predicted by AlphaFold 3 with the highest ipTM score. (d) Complex of spinach Pc and turnip Cyt f predicted by AlphaFold 3 with the lowest ipTM and the highest EDC scores. (e) Complex of spinach Pc and spinach Cyt f predicted by AlphaFold 3 with the lowest ipTM and the highest EDC scores. (f) Complex of spinach Pc and spinach Cyt bf predicted by AlphaFold 3 with the highest ipTM and the highest EDC scores. (g) NMR structure (PDB id 2pcf, model 9) for spinach Pc and turnip Cyt f. (h) NMR structure (PDB id 1tkw, model 7) for poplar Pc and turnip Cyt f. Backbone and cofactors of Pc and Cyt f molecules are colored by EDC score from blue (zero and lower) to yellow (0.15 and higher). EMD-14123 density is depicted by grey isosurface 0.15 a.u.

