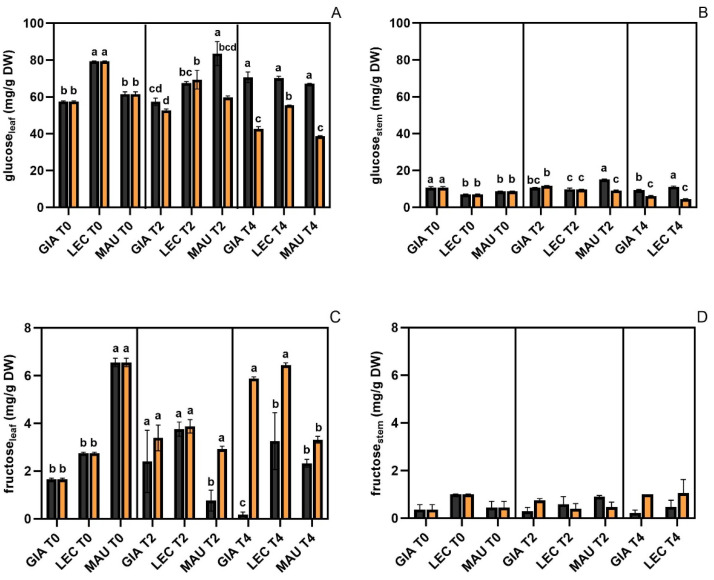
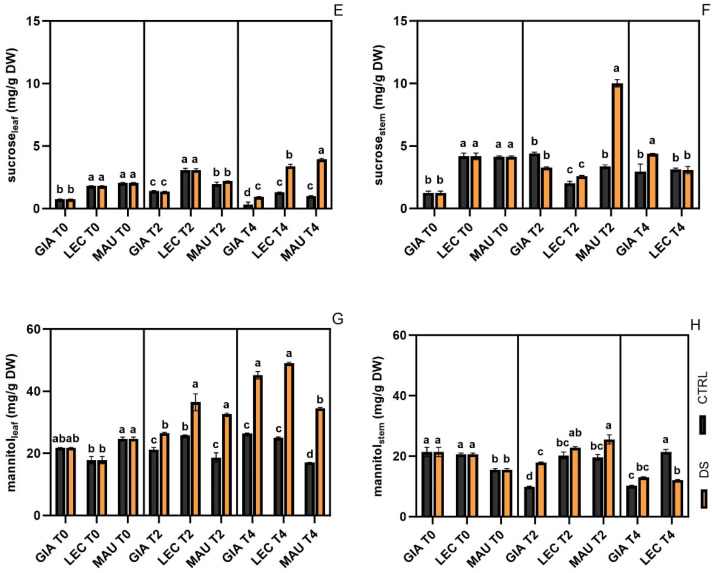
Figure 1.
Sugar levels identified by HPLC in Giarraffa (GIA), Leccino (LEC) and Maurino (MAU) under control (CTRL, black) and drought stress (DS, orange). (A) Glucose in leaf; (B) glucose in stem; (C) fructose in leaf; (D) fructose in stem; (E) sucrose in leaf; (F) sucrose in stem; (G) mannitol in leaf; (H) mannitol in stem, all expressed in mg g−1 tissue dry weight (DW). Data in each column are presented as mean ± standard error. Within each time point, different letters denote statistical significance (p-value < 0.05) according to Tukey’s multiple post hoc tests.


