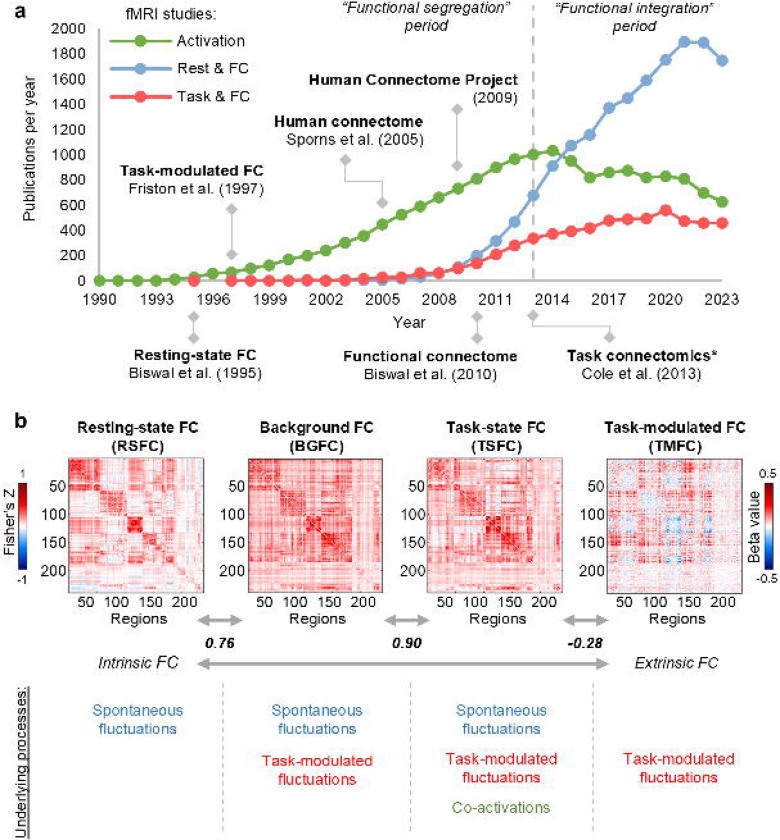
Fig. 1. Overview of FC types.
(a) fMRI publications per year mentioning “activation” (green), “functional connectivity” and “rest” (red), “functional connectivity” and “task” (blue). Data obtained via PubMed search from 1990 to 2023. Here, we note the trend shift in the fMRI field from studies of functional segregation (activation studies) to functional integration (connectivity studies) since 2013. We also observe the dominance of RSFC studies since 2015. (*) – The term “task connectomics” was introduced first introduced by Di et al. (2017)20, however, the first large-scale task connectomics study to analyze whole-brain TMFC across multiple tasks was conducted by Cole et al. (2013)21. (b) Illustration of various types of FC matrices along the intrinsic-extrinsic axis. To calculate FC matrices, we used resting-state and working memory task data from the Human Connectome Project. To estimate TMFC, we applied the gPPI method with the deconvolution procedure (“2-back > 0-back” contrast). To evaluate the similarity between matrices, we used Pearson’s r correlation. The color scales were adjusted for each matrix based on the maximum absolute value and were assured to be positive and negative symmetrical.

