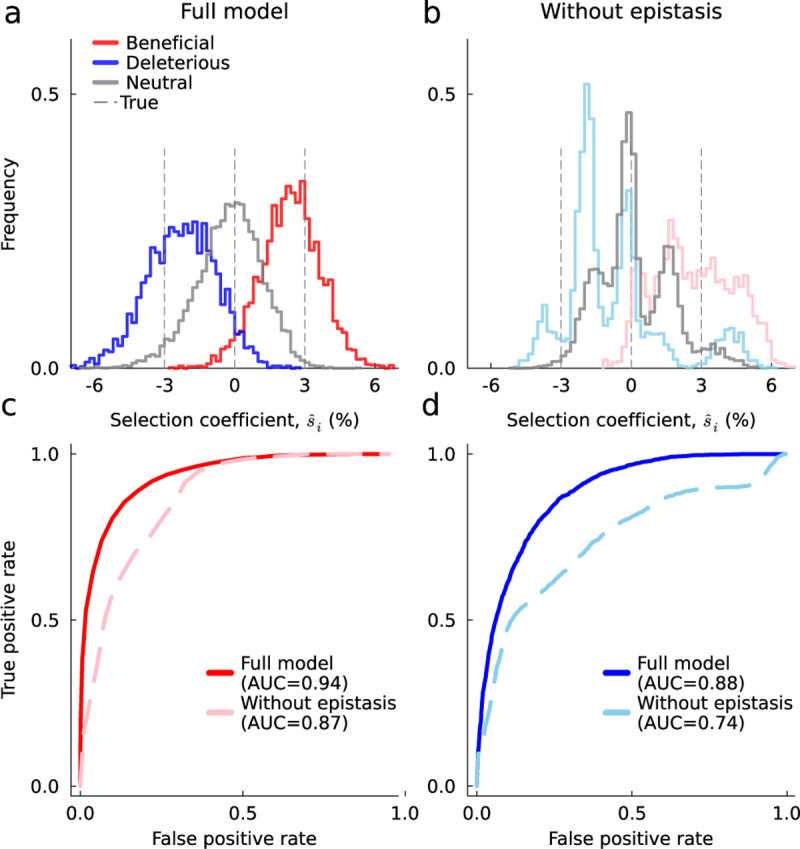
Fig. 3. Modeling epistasis improves the inference of additive selection coefficients.

Distribution of selection coefficients inferred with the full model via HCMF (a) and a simpler model with no epistatic interactions (b). When epistasis is present, including it in the model also improves estimates of selection coefficients. c, ROC curves and their AUC values for identifying positive selection coefficients. The AUC value of the full model is 0.94, while the AUC value of the model without epistasis drops to 0.87. d, Analogous ROC and AUC values for identifying deleterious selection coefficients. The AUC values are 0.88 and 0.74 for the full model and the model without epistasis, respectively. Simulation parameters are the same as in Fig. 2.
