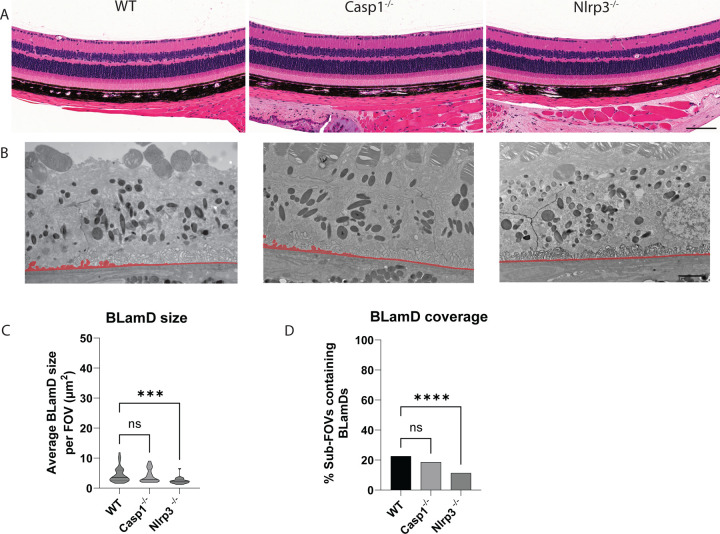
Fig. 10. Nlrp3 deficiency protects mice from spontaneous BLamD deposit formation.
(A) 12 mo H&E-stained histology images of WT, Casp1−/−, and Nlrp3−/− mice. Scale bar = 100 μm. (B) Representative TEM images from 12 mo mice. (C, D) quantitation of BLamD size (μm2/FOV) and percent sub-FOVs containing BLamDs. Scale bar = 2 μm Comparative analysis performed using Kruskal-Wallis test. **** p < 0.0001. Note: The WT TEM image and WT BLamD quantification are identical to that shown previously in Fig. 2A–E.

