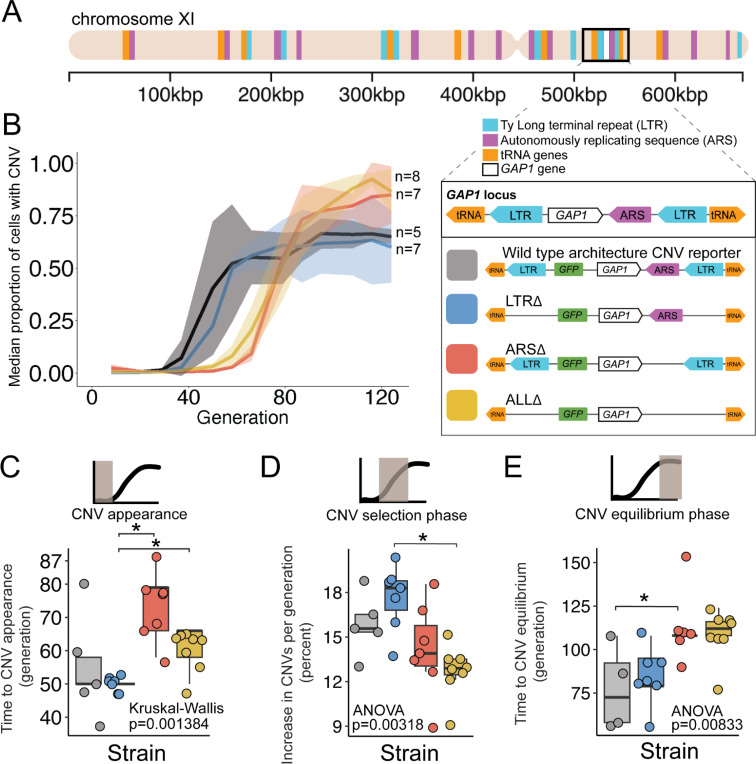
Figure 1. A local DNA replication origin contributes to CNV dynamics during adaptive evolution.
(A) The Saccharomyces cerevisiae GAP1 gene is located on the short arm of chromosome XI (beige rectangle). Light blue rectangle - Ty Long terminal repeats (LTR). Purple rectangle - Autonomously replicating sequences (ARS). Orange rectangles - tRNA genes. GAP1 ORF - white rectangle. The GAP1 gene (white rectangle) is flanked by Ty1 LTRs (YKRCδ11, YKRCδ12), which are remnants of retrotransposon events, and is directly upstream of an autonomously replicating sequence (ARS1116). Variants of the GAP1 locus were engineered to remove either both LTRs, the single ARS, or all three elements. All engineered genomes contain a CNV reporter. (B) We evolved the four different strains in 5–8 replicate populations, for a total of 27 populations, in glutamine-limited chemostats and monitored the formation and selection of de novo GAP1 CNVs for 137 generations using flow cytometry. Population samples were taken every 8–10 generations and 100,000 cells were assayed using a flow cytometer. Colored lines show the median proportion of cells in a population with GAP1 amplifications across 5–8 replicate populations of the labeled strain. The shaded regions represent the median absolute deviation across the replicates. (C) We summarized CNV dynamics and found that strain has a significant effect on CNV appearance (Kruskal-Wallis, p =0.001384). There are significant differences in CNV appearance between LTRΔ (blue) and ARSΔ (red), and LTRΔ (blue) and ALLΔ (yellow) (pairwise wilcoxon test with Bonferroni correction, p=0.0059 and p=0.0124, respectively). (D) Strain has a significant effect on the per generation increase in proportion of cells with CNV (ANOVA, p = 0.00318) calculated as the slope during CNV selection phase. There is a significant difference between LTRΔ (blue) and ALLΔ (yellow) (pairwise t-test with Bonferroni correction, p = 0.0026). (E) Strain has a significant effect on time to CNV equilibrium phase (ANOVA, p = 0.00833). There is a significant difference in time to CNV equilibrium between WT and ARSΔ (pairwise t-tests with bonferroni correction, p =0.050).

