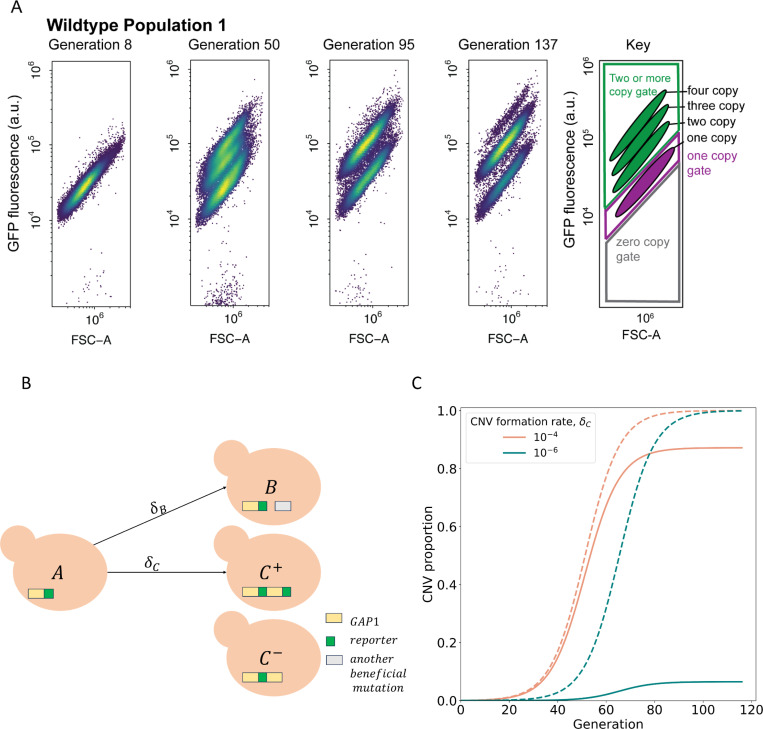
Figure 2. CNV reporter failure does not impact parameter inference.
(A) Flow cytometry of a representative WT population with a persistent one-copy GFP subpopulation, bottom in each panel. FSC-A is forward scatter-area which is a proxy for cell size (x-axis). GFP fluorescence was measured in arbitrary units (a.u.) (y-axis). Hierarchical gating was performed to define the one-copy GFP and two-or-more copy subpopulations (see Methods). (B) Model illustration. is the frequency of ancestor cells in the chemostat;, are the frequencies of cells with GAP1 duplications with two or one reporters, respectively, and a selection coefficient ; is the frequency of cells with other beneficial mutations and a selection coefficient . GAP1 duplications form with a rate , other beneficial mutations occur with rate . At generation 0, only genotypes and 𝐴 are present, with frequencies of and . (C) Examples of total CNV proportions (dashed) and reported CNV proportions (solid) for two parameter combinations, both with , .

