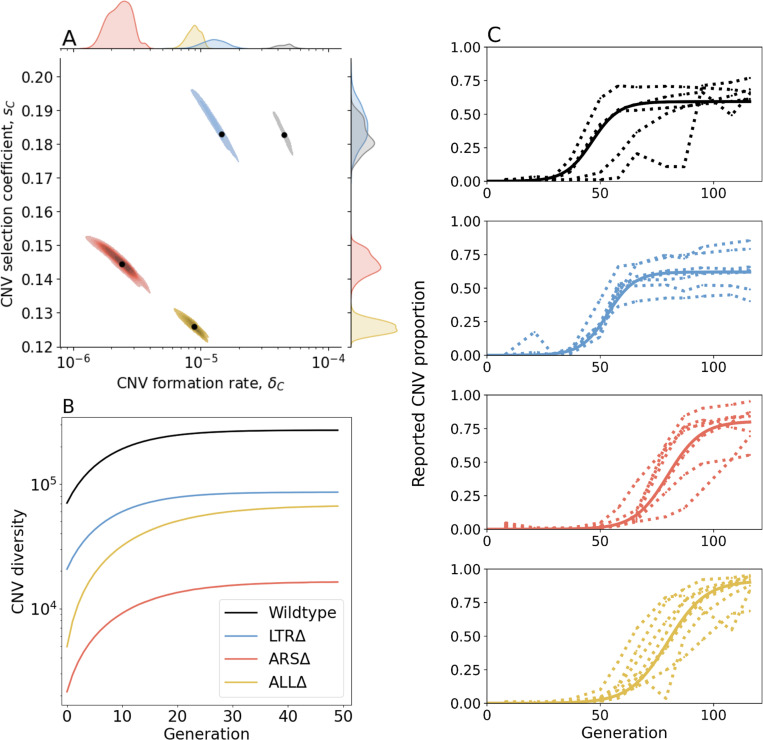
Figure 3. Inference of CNV formation rate and selection coefficient from experimental evolutionary data.
(A) Collective MAP estimate (black markers) and 50% HDR (colored areas) of GAP1 CNV formation rate, , and selection coefficient, . Marginal posterior distributions are shown on the top and right axes. (B) Collective posterior prediction of Shannon diversity of CNV lineages (, Jost, 2006). Line and shaded area show mean and 50% HDI. (C) CNV reported frequency prediction using collective MAP (solid line) compared to empirical observations (dotted lines).

