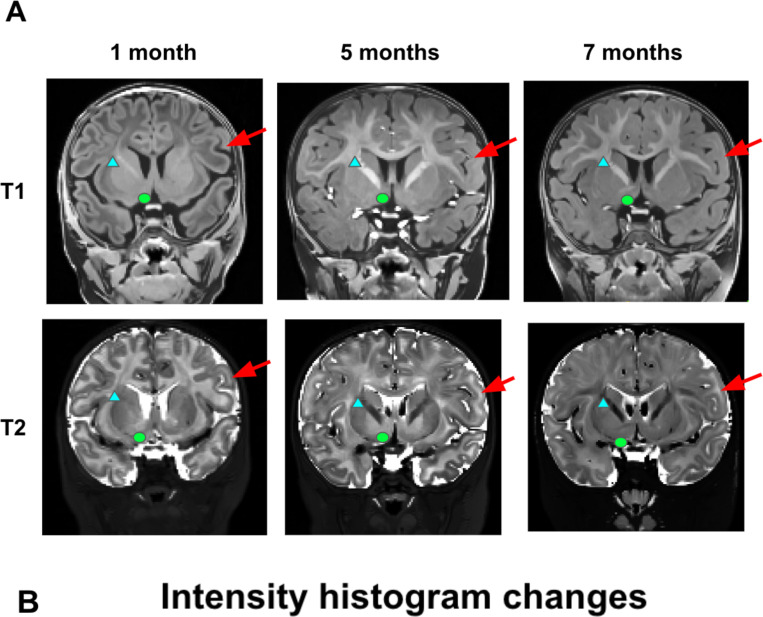
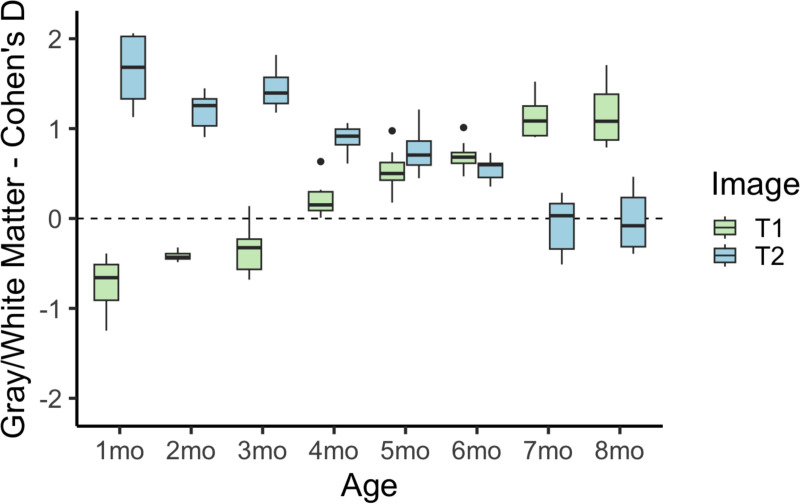
Figure 3.
T1w and T2w images show dramatic developmental differences across the age range considered. (A) The selected images are from the same participant at three different ages, clearly depicting the transition from unmyelinated to myelinated white matter, and the differing image contrast intensities in the T1w vs. T2w at each age. Red arrows point out cortical gray/white matter changes, blue triangles point out internal capsule white matter changes, and green circles point out nucleus accumbens region changes (B) Cohen’s d values of white-gray matter differentiation are plotted for T1w and T2w MRI images. Considering both the T1w and the T2w images at this age group is critical to fully capture the white matter and subcortical boundaries.


