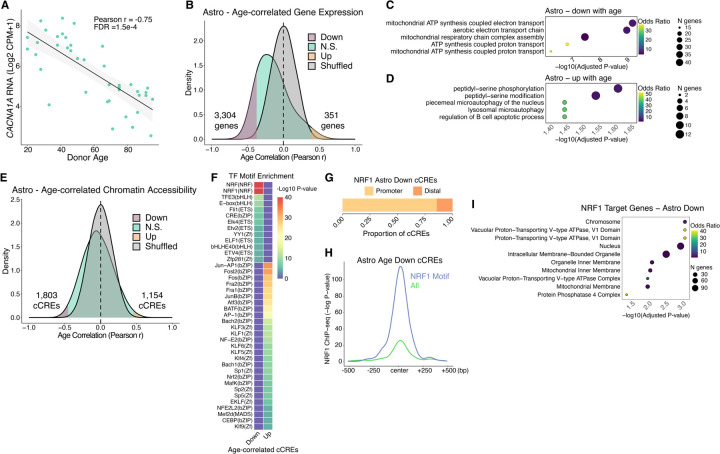
Fig. 3. Aging gene regulatory programs in astrocytes.
(A) Scatter plot of ZNF804A expression vs. donor age. (B) Density plots for Pearson r values of age vs. expression (log2 CPM+1) across 40 donors. Shuffled represents a null distribution of shuffling the expression values of the donors for each gene. (C and D) Gene ontology dot plots displaying significant biological process enriched terms for age-correlated genes that decrease with age (C) or increase with age (D) in astrocytes. (E) Density plots for Pearson r values of age vs. chromatin accessibility (log2 CPM+1) across 40 donors. (F) TF motif enrichment heatmap for significant enrichments, q-value < 0.05. “Up” indicates chromatin accessibility increases with age and “Down” indicates chromatin accessibility decreases with age. (G) Ratio of cCREs with negatively age-correlated accessibility in astrocytes with an NRF1 TF motif that are either promoter proximal (<1 kb) or promoter distal (> 1kb) from a protein-coding transcription start site. (H) Average −Log p-value NRF1 ChIP-seq signal in SK-N-SH cell line (ENCODE Accession ENCFF762LEE) at all astrocyte cCREs that decrease accessibility with age (n = 1803, yellow line) or the subset that contain an NRF1 TF motif (n = 354, blue line). (I) Gene ontology biological process significantly enriched terms (q-value < 0.05) for genes that have negative age-correlated accessibility in astrocytes with an NRF1 TF motif at their promoter.

