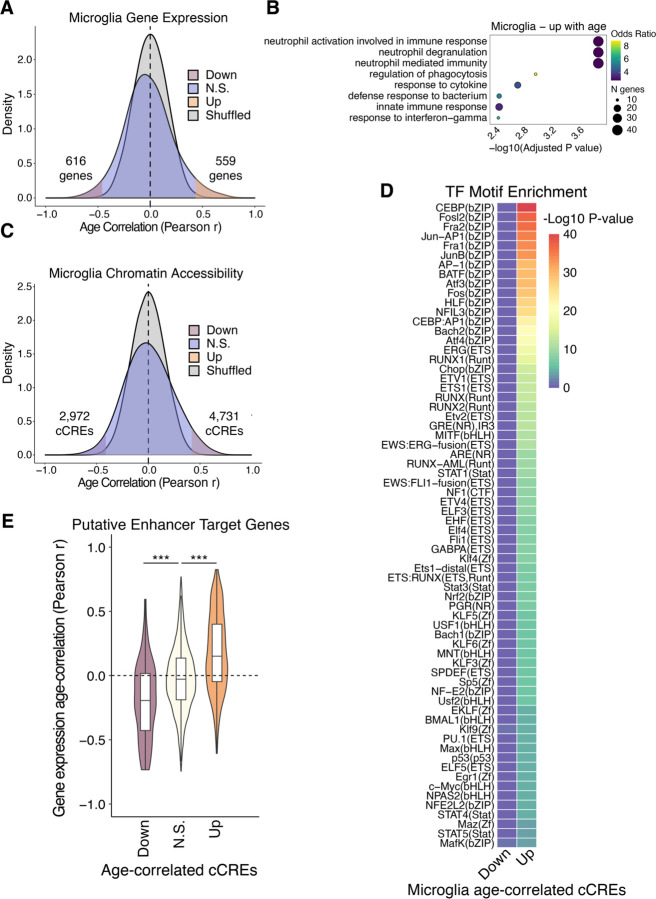
Fig 4. Aging gene regulatory programs in microglia.
(A) Density plots for Pearson r values of age vs. expression (log2 CPM+1) across 40 donors. Shuffled represents a null distribution of shuffling the expression values of the donors for each gene. (B) Gene ontology dot plots displaying significant biological process enriched terms for age-correlated genes that increase with age in microglia. (C) Density plots for Pearson r values of age vs. chromatin accessibility (log2 CPM+1) across 40 donors. (D) TF motif enrichment heatmap for significant enrichments, q-value < 0.05. “Up” indicates chromatin accessibility increases with age and “Down” indicates chromatin accessibility decreases with age. (E) Violin plots showing the distribution of Pearson correlation coefficients for age-correlation of expression for target genes of predicted ABC enhancers. P-values from two-sided, unpaired Wilcoxon-rank sum test. * p < 0.05, ** p < 0.01, *** p < 0.001

