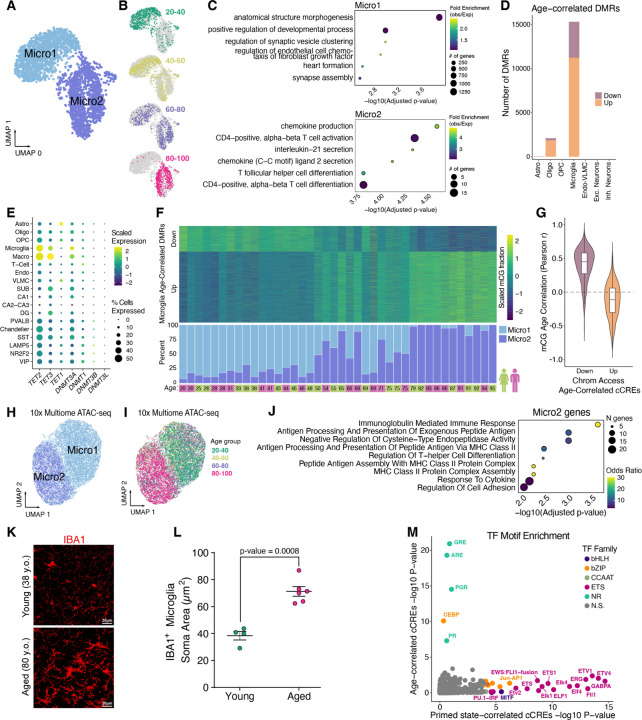
Fig. 5. Epigenetic cell state switch in aging microglia.
(A) UMAP plot of microglia from snm3C-seq, annotated with 2 DNA methylation microglia subclusters. (B) UMAP embeddings showing the distribution of microglia cells across different age groups. (C) Dot plots displaying gene ontology terms for enriched biological processes for the nearest genes (closest transcription start site) from DMRs hypomethylated in Micro1 (top) and Micro2 (bottom). (D) Stacked bar plots showing number of significant (FDR < 0.1) age-correlated DMRs in each subclass. (E) Dot plot showing the scaled average single cell gene expression levels of enzymes involved in DNA (de)methylation across cell types. The color of each dot represents the expression level and the size indicates the percentage of cells expressing the gene. (F) Heatmap of Age-correlated DMRs (rows), displaying row-scaled methylated cytosine proportions for each donor (columns) (top) and stacked bar plots showing the ratio of Micro1 to Micro2 cells recovered for each donor in snm3C-seq experiments (bottom). (G) Violin plots showing the distribution of Pearson correlation coefficients for age-correlation of mCG fractions at DMRs overlapping age-correlated cCREs. (H) UMAP displaying microglia 10x multiome clustered by ATAC-seq cCREs identified in microglia that overlap Micro1 or Micro2 DMRs (n = 3,405). Cells colored by Micro1 or Micro2 annotation. (I) Same as (H) except cells colored by age group. (J) Significant GO Biological Process enriched terms for Micro2 differentially upregulated genes compared to Micro1. (K) Representative micrographs of IBA immuno-stained hippocampus CA3 region in two human donors. (L) Dot plot showing quantification of microglia soma area between young (n=3; 20–38 y.o.) and aged (n=6; 80+ y.o.). P-value from linear mixed-effect model (LME). (M) Scatter plot displaying TF motif enrichment for cCREs either Micro2 percentage correlated (“Primed-state correlated cCREs”, fig. S13B) or age-correlated (fig. S13C) in 16 donors. Only TF motifs with q-value < 0.05 are colored by their TF family.

