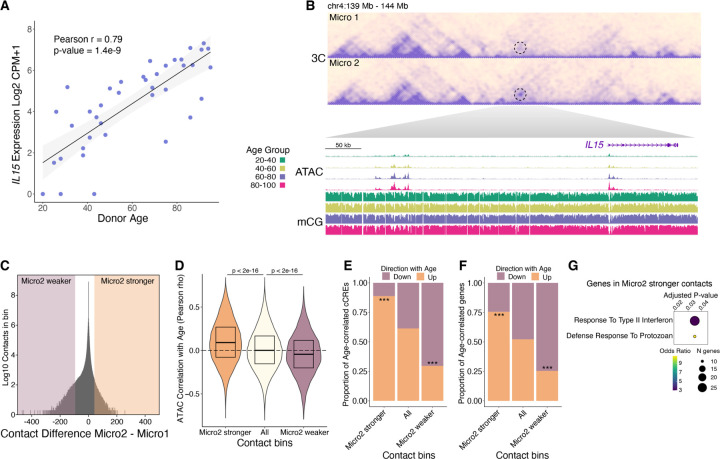
Fig. 6. Correspondence between age-correlated 3D genome reorganization with the epigenome and transcriptome.
(A) Scatter plot of IL15 expression vs. donor age. (B) Heatmap showing contact frequency in Micro1 and Micro2. A dotted circle highlighting the contacting regions between the IL15 promoter and an upstream cluster of cCREs. WashU browser snapshots of the circled region displaying chromatin accessibility and mCG fraction in microglia across age groups. (C) Density plot of contact differences, subtracting Micro2 from Micro1 contacts for each 100kb genomic bin after sampling equal number of total contacts for each group. Differential contact bins in the top ±0.0005% percentile are highlighted. (D) Violin plots showing the distribution of age-correlated chromatin accessibility for all microglia cCREs in the indicated contact bins. (E and F) Stacked bar plots show proportions of age-correlated cCREs (E) and age-correlated genes (F) within Micro2 differential contact bins. P-values computed using Pearosn’s Chi-square test comparing Micro2 higher up with All up or Micro2 lower down with All down, *** p < 0.001. (G) Gene ontology biological process enriched terms (q-value < 0.05) for genes having a transcription start site within a Micro2 higher contact bin.

