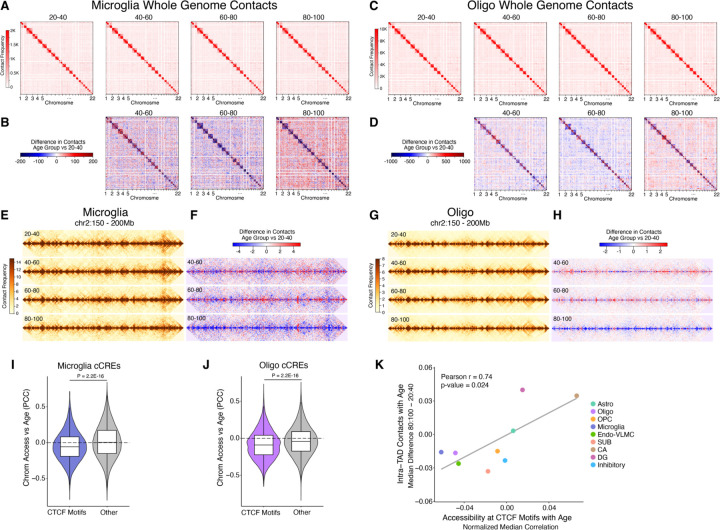
Fig. 7. Global loss of homeostatic 3D genome architecture and CTCF binding in aging hippocampal cells.
(A) Aggregated raw interchromosomal contact maps of microglia across different age groups. (B) Heatmaps showing the contact frequency differences in microglia between the 40–60, 60–80, and 80–100 age groups compared to the 20–40 age group. (C) Aggregated raw interchromosomal contact maps of oligodendrocytes across different age groups. (D) Heatmaps showing the contact frequency differences in oligodendrocytes between the 40–60, 60–80, and 80–100 age groups compared to the 20–40 age group. (E) Aggregated contact maps for microglia across each age group in the region chr2:150,000,000–200,000,000 at 100 kb resolution. (F) Heatmaps of contact frequency differences in microglia for the 40–60, 60–80, and 80–100 age groups compared to the 20–40 age group within chr2:150,000,000–200,000,000 at 100 kb resolution. (G) Aggregated contact maps for oligodendrocytes across each age group in the region chr2:150,000,000–200,000,000 at 25 kb resolution. (H) Heatmaps of contact frequency differences in oligodendrocytes for the 40–60, 60–80, and 80–100 age groups relative to the 20–40 age group within chr2:150,000,000–200,000,000 at 25 kb resolution. (I) Violin plots showing the distributions of age-correlation of chromatin accessibility at cCREs overlapping CTCF motifs or cCREs not overlapping CTCF motifs “Other” in microglia or (J) oligodendrocytes. (I and J) P-values derived from two-sided, unpaired Wilcoxon-rank sum test. (K) Scatter plot representing the difference in the median of all intra-TAD contacts (80:100 – 20:40 age groups) vs the median Pearson age-correlation of chromatin accessibility at CTCF motifs subtracted from the median Pearson age-correlation of all cCREs for each cell type.

