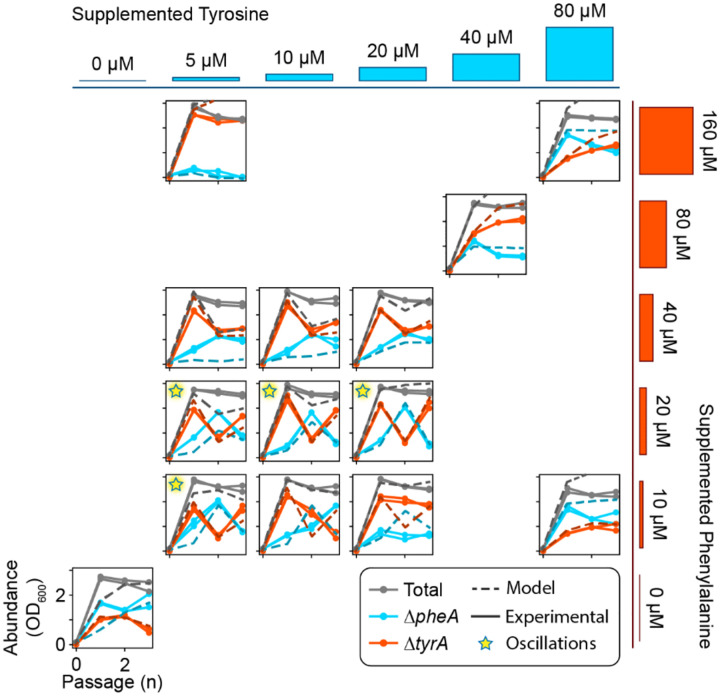
Extended Data Fig 1. Community dynamics in response to varying concentrations of supplemented amino acids.
Communities composed of and were subjected to daily passages for three days according to the experimental scheme shown in Fig. 1c. The media was supplemented with tyrosine and phenylalanine, and the magnitude of supplementation was varied independently for each amino acid. Each subplot demonstrates the community dynamics for a distinct media composition, which is represented by the cyan and red bars on the top and right of the subplots. Cyan trajectories over time represent the absolute abundance of the auxotroph while orange trajectories over time represent the abundance of . Solid lines correspond with experimental data while dashed lines show predictions based on the full model (equation (1)) with the inferred parameter set (Extended Data Table 1). Stars in the top left of certain subplots indicate oscillatory dynamics.

