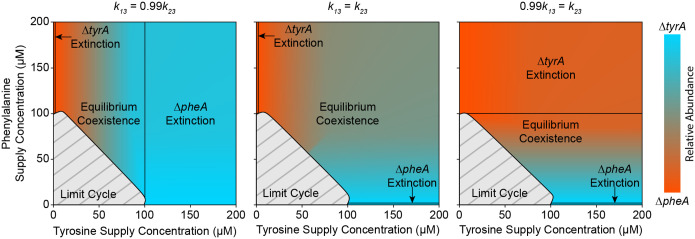
Extended Data Fig. 3. The orientation of transcritical bifurcations and compositional invariance to amino acid depends on the competitive ability of each strain for glucose.
Three bifurcation maps are provided based on the full model (equation (1)) using a simplified parameter set (Extended Data Table 1) where all parameters are symmetrical between species except for the glucose half saturation constants and . Shading between cyan and red maps the steady state community composition to an input of amino acids. Light grey regions with dark grey hashing indicate oscillatory dynamics. Sold black lines represent boundaries between equilibrium coexistence and competitive exclusion. When is less than (left plot), then species 1 is a better competitor for glucose and the region of exclusion is more distinguishing. This community also shows compositional invariance to phenylalanine. The converse is true when is less than (right plot). In the perfectly symmetrical case where is equal to (middle plot), both amino acids affect the community composition, and the regions of competitive exclusion are minor.

