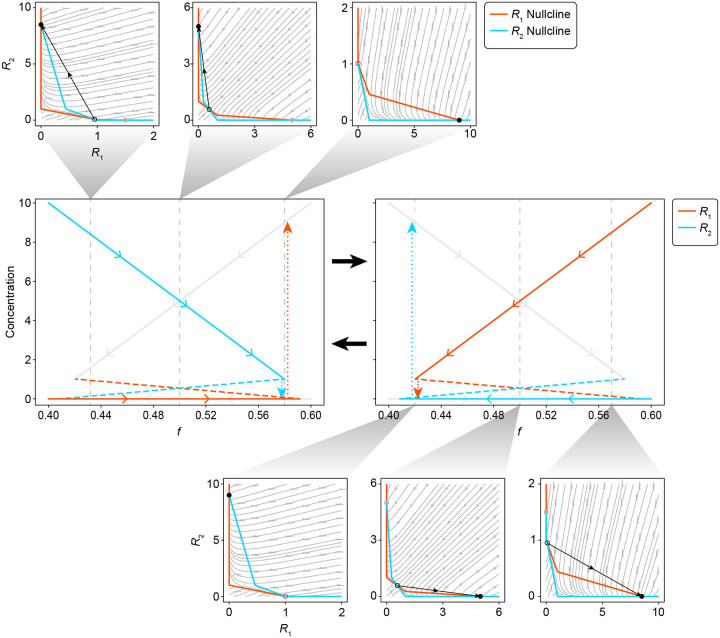
Extended Data Fig. 5.
Model reduction leads to a system that exhibits relaxation oscillations when is satisfied. The two central plots show the continuation of the (red) and (cyan) steady states as a function of fractional abundance in the community. At any given moment, only one of the two sets of steady state solutions are active, which is the distinguishing feature between the two central plots. The inactive steady state solutions are plotted with grey lines. Solid lines are used to indicate stable steady states while dashed lines are used to indicate unstable steady states. Dotted lines indicate the rapid transition between stable states that occurs at the point of annihilation. Each continuation plot is associated with a set of phase portraits showing the and streamlines, and how the steady states change with respect to the community composition. The and nullclines are plotted in red and cyan respectively. The active stable steady state is shown as a solid black dot, while its inactive counterpart is shown as a solid grey dot. The unstable steady state is shown as an open circle.

