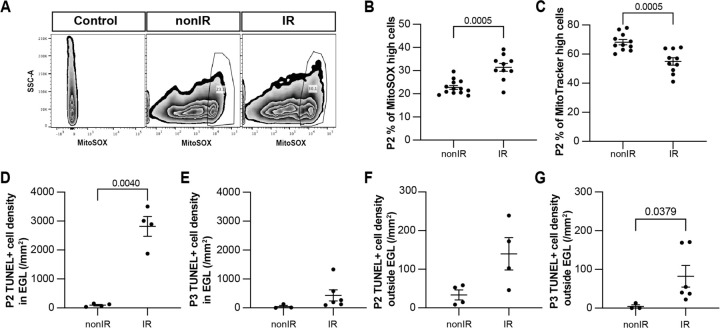
Figure 2: Cerebellar injury at P1 results in increased superoxide production, a reduction in mitochondria and increased cell death in the EGL that peaks 24h after injury.
(A) Examples of flow cytometry analysis of mitochondrial ROS at P2 from nonIR and IR cerebella using MitoSOX dye. Gating determined the top 90% MitoSOX signal (MitoSOX high cells).
(B, C) Quantification of MitoSOX high (B) and MitoTtracker high (C) expression in nonIR and IR cerebella at P2.
(D, E) Quantification of TUNEL+ cell density in the EGL at P2 (D) and P3 (E) in lobules 3–5 of nonIR and IR mice.
(F, G) Quantification of TUNEL+ cell density outside the EGL at P2 (F) and P3 (G) in lobules 3–5 of nonIR and IR mice.
EGL, External granular layer; SSC, side scatter; P, postnatal day; nonIR, non-irradiated; IR, irradiated. All statistical significance was determined using an unpaired t-test and data are represented as mean ± SEM.

