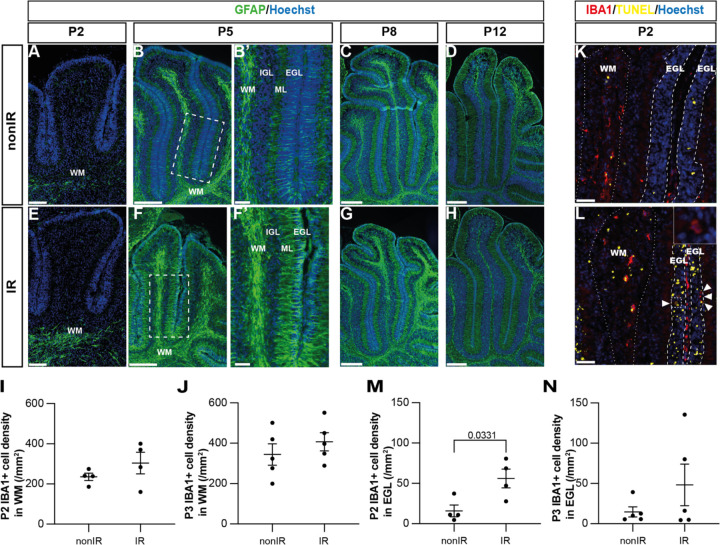
Figure 3: Cerebellar injury at P1 induces transient microglial recruitment to the EGL and prolonged astroglial microenvironment changes in the cerebellum.
(A-H) Immunohistochemical (IHC) staining of medial sagittal cerebellar sections for GFAP (green) in lobules 4/5 of nonIR and IR cerebellum at the stages indicated. Nuclei were counterstained with Hoechst. (B’) and (F’) show high-power images of white dashed line boxes in (B) and (F), respectively.
(I, J) Quantification of IBA1+ cell density in the WM at P2 (I) and P3 (J) in lobules 3–5 of nonIR and IR mice.
(K, L) IHC staining of medial sagittal cerebellar sections for IBA1 and TUNEL in lobule 3 of nonIR and IR cerebellum at P2. Nuclei were counterstained with Hoechst. White matter (WM) and external granular layer (EGL) are delineated by white dotted lines and dashed lines, respectively. High-power image in (L) of the area indicated by the white dashed line represents an IBA1+ cell present in the EGL. White arrowheads indicate additional IBA1+ cells in the EGL.
(M, N) Quantification of IBA1+ cell density in the EGL at P2 (M) and P3 (N) in lobules 3–5 of nonIR and IR mice. EGL, External granular layer; WM, White matter; P, postnatal day; nonIR, non-irradiated; IR, irradiated. Scale bar: A and E 100μm, B, C, D, E, F, G and H: 250μm, B’ and F’: 50μm, I and J: 50μm. All statistical significance was determined using an unpaired t-test and data are represented as mean ± SEM.

