
Figure 4: Reduction of ROS impairs adaptive reprogramming and cerebellar repair.
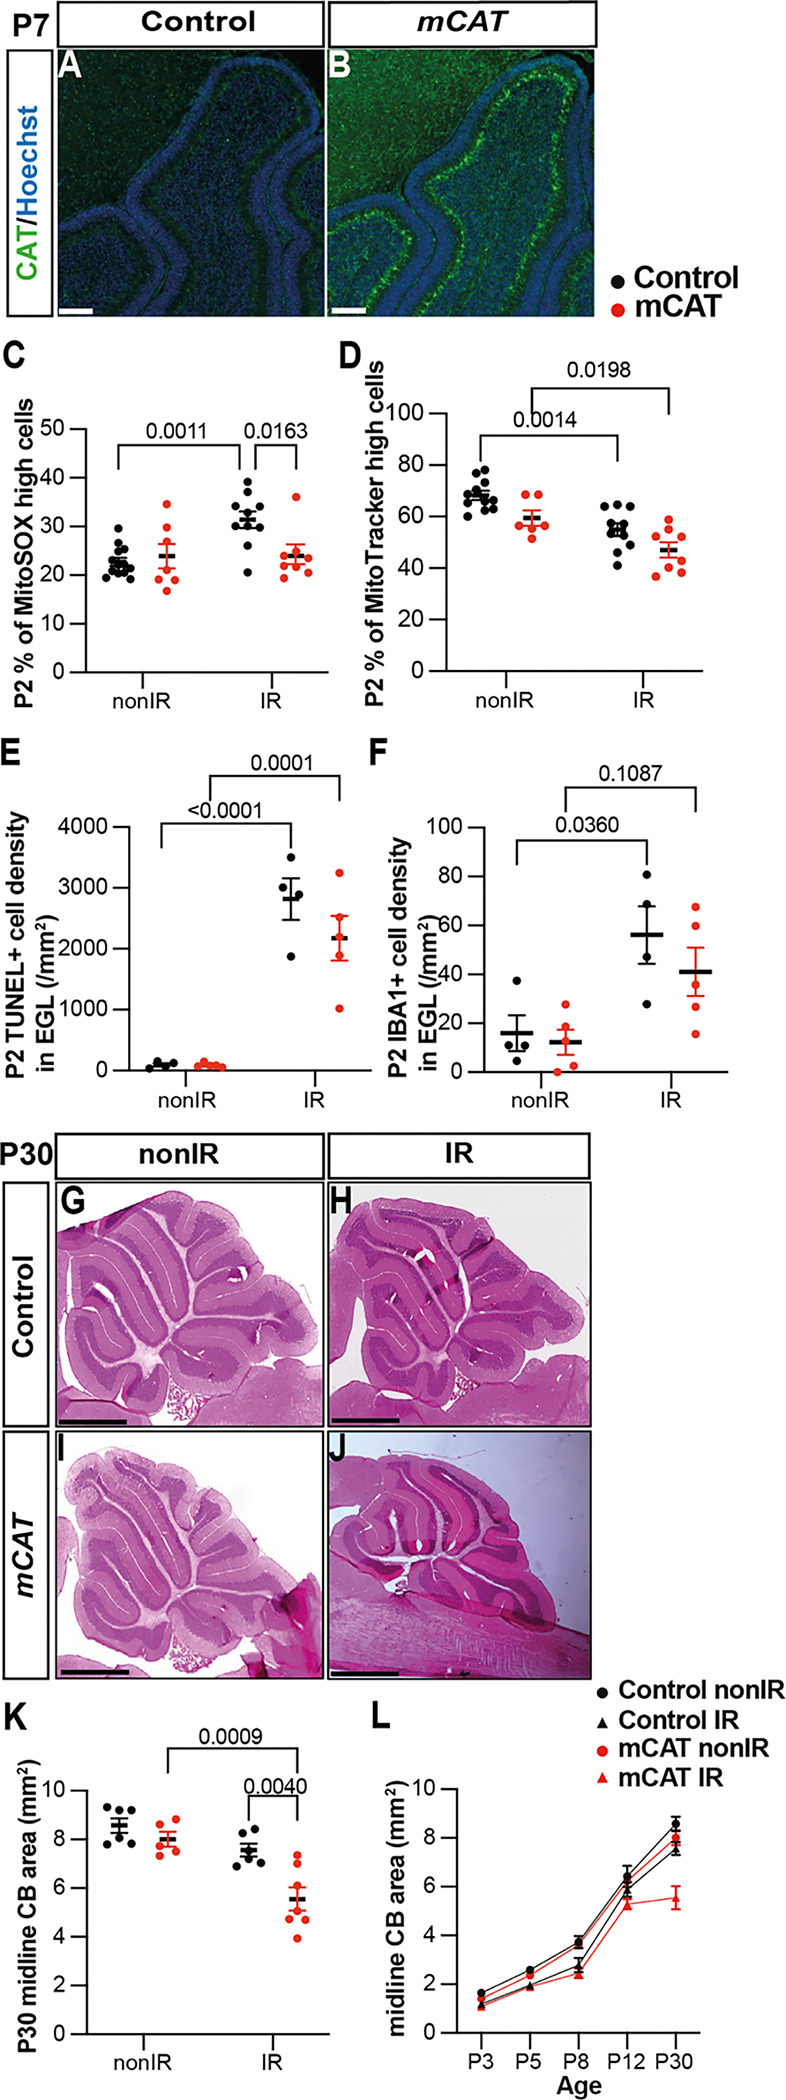
(A, B) IHC staining of medial sagittal cerebellar sections for human catalase in control (A) AND mCAT/+ mice (B) at P7. Nuclei were counterstained with Hoechst (blue). Similar staining was seen in four mCAT/+ mice.
(C) Quantification of MitoSOX high expression at P2 in control and mCAT/+ cerebella, with and without irradiation at P1 (Two-way ANOVA, F(1,34)=6.768, p=0.0136).
(D) Quantification of MitoTracker high expression at P2 in control and mCAT/+ cerebella, with and without irradiation at P1 (Two-way ANOVA, F(1,31)=25.06, p<0.0001).
(E) Quantification of TUNEL+ cell density in the EGL at P2 in control and mCAT/+ cerebella, with and without irradiation at P1 (Two-way ANOVA, F(1,14)=87.56, p<0.0001).
(F) Quantification of IBA1+ cell density in the EGL at P2 in control and mCAT/+ cerebella, with and without irradiation at P1 (Two-way ANOVA, F(1,14)=15.58, p=0.0015).
(G-J) Hematoxylin and eosin staining on mid-sagittal sections of P30 control and mCAT/+ cerebellum with or without irradiation.
(K) Quantification of P30 cerebellar mid-sagittal section area in controls and mCAT/+ nonIR and IR mice (Two-way ANOVA, F(1,20)=11.82, p=0.0026).
(L) Graph showing the average area of mid-sagittal cerebellar sections at P3, P5, P8, P12 and P30 in control and mCAT/+ non-irradiated and irradiated mice. Detailed statistics are shown in Supplementary Figure 4.
EGL, External granular layer; P, postnatal day; nonIR, non-irradiated; IR, irradiated. Scale bar: A and B: 100μm, F-I: 1mm. Significant Tukey’s post hoc multiple comparison tests are shown in the figures and data are represented as mean ± SEM.