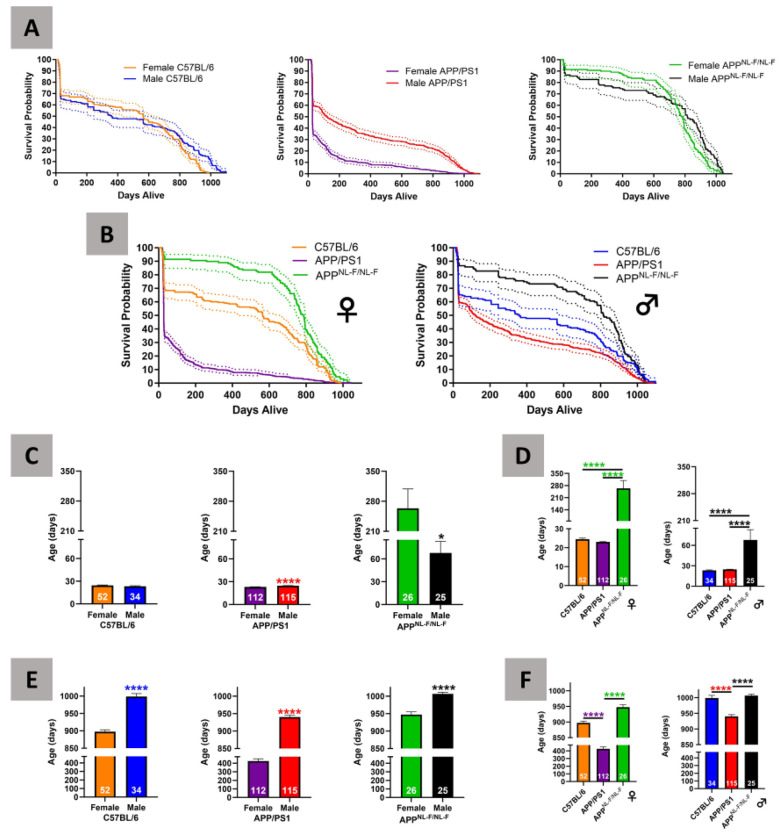
Figure 1 –
Survival and longevity analysis of C57BL/6, APP/PS1, and APPNL-F/NL-F mice
Kaplan Meier curve is shown as a solid line, 95% confidence limits are expressed as dotted lines. Survival curves comparing between sex (Fig. 1A) and between genotypes (Fig. 1B). Minimal longevity between sex (Fig. 1C) and genotype (Fig. 1D) comparisons for the shortest surviving 20%. Maximal longevity between sex (Fig. 1E) and genotype (Fig. 1F) comparisons for the oldest surviving 20%.

