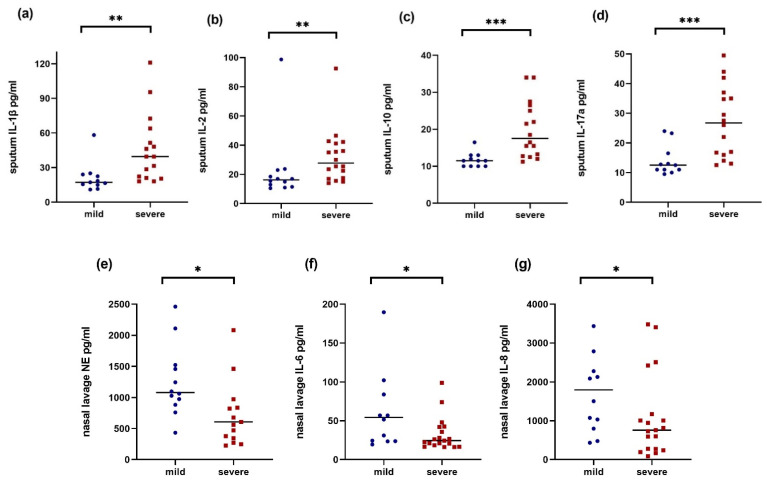
Figure 2.
Sputum IL-1β (a) #, sputum IL-2 (b), sputum IL-10 (c) #, sputum IL-17a (d), NL NE (e) †, NL IL-6 (f) †, and NL IL-8 (g) † in mild (blue circles) and severe (red squares) CF patients. Line represents median and p-values represent results of Mann–Whitney U test. Note: NL NE: Four severe patients were excluded because the values were below the detection limit, and one high value is not displayed (3081 pg/mL). # n = 11 in mild and n = 15 in severe due to technical issues. † n = 12 in mild. * p < 0.05, ** p < 0.01, *** p < 0.001.

