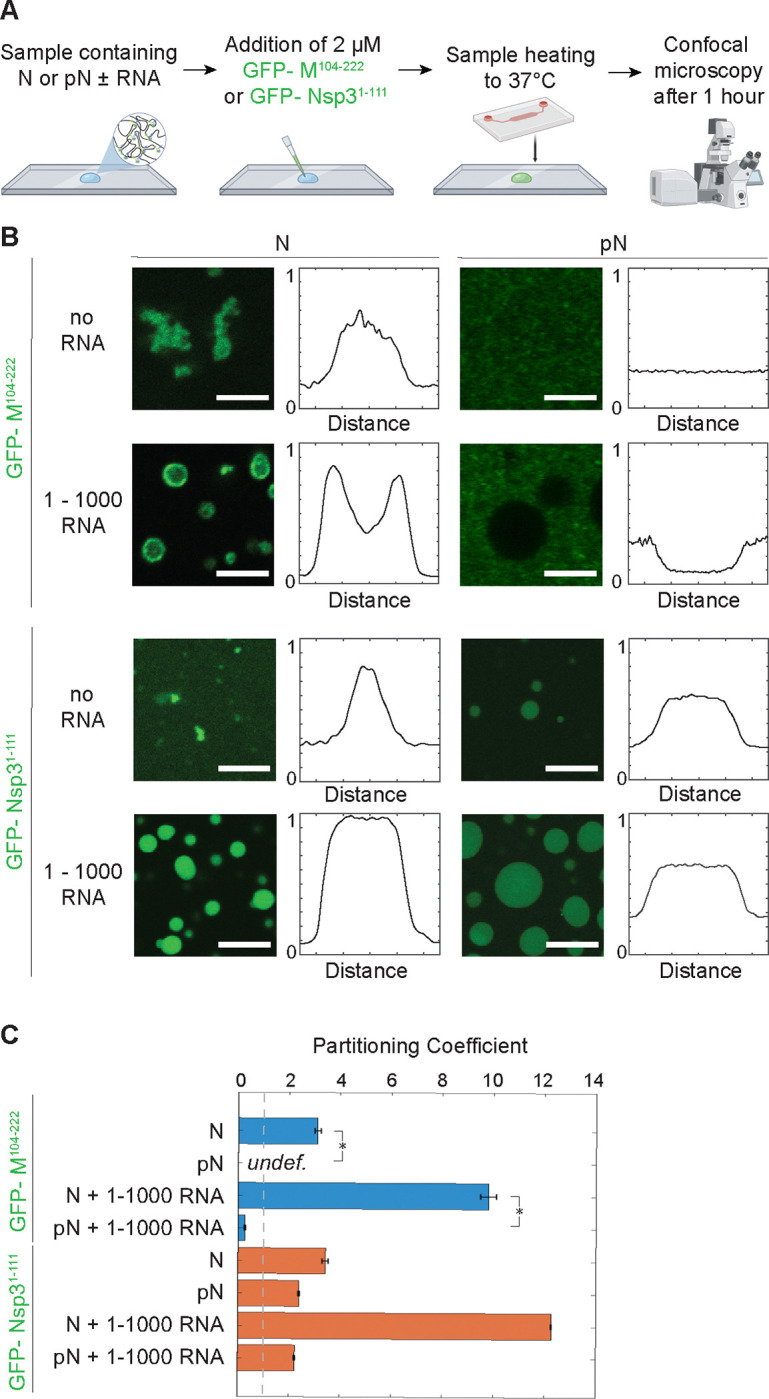
Figure 3: N and pN interaction with membrane proteins, M and NSP3.

A) Schematic of the experimental setup where 6xHis-GFP-M104−222 or 6xHis-GFP-NSP31−111 is added to a condensate sample and partitioning of GFP-tagged protein is quantified using confocal microscopy. B) Representative confocal images from condensates composed of 40 μM N or pN plus either no RNA or 300 nM RNA; plus either 2 μM 6xHis-GFP-M104−222 or 6xHis-GFP-NSP31–111. 6xHis-GFP-M104−222 binds to N but not pN condensates while 6xHis-GFP-NSP31−111 partitions in regardless of choice of N vs. pN. Normalized line profiles across condensates, representing averages of at least n = 20 condensates from 3 independent trials. Scale bars = 5 μm. C) Quantification of partitioning of GFP-tagged proteins into N or pN condensates by dividing average fluorescence inside condensates (if any) by the average background fluorescence. Error bars represent one standard deviation (±1 s.d.). p values were determined using two-way ANOVA followed by post hoc Tukey’s test. *p < 0.01.
