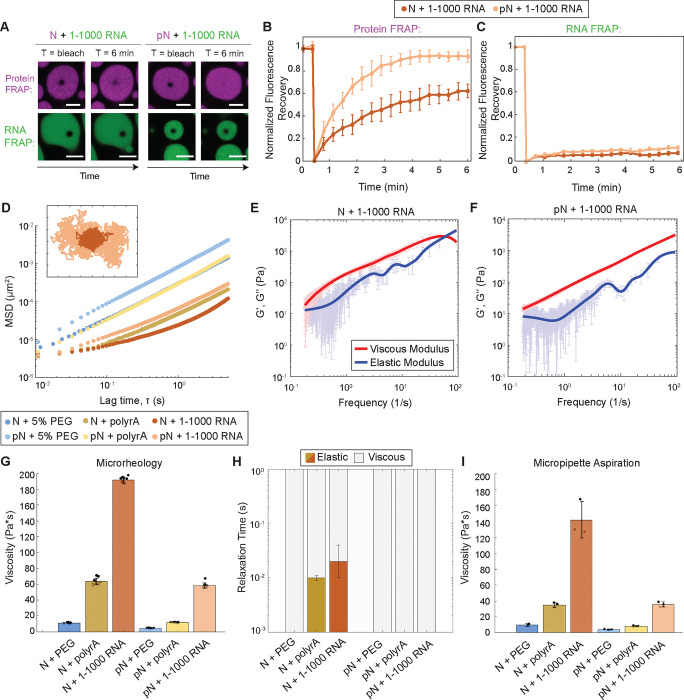
Figure 4: Phosphorylation modulates material properties of N and RNA condensates.
A) Fluorescence recovery after photobleaching (FRAP) of N and RNA condensates, in which 5% of N/pN is labeled with Alexa-647 and 5% of RNA is labeled with Cy-3. pN recovers to a greater extent over time when compared to N, while in neither case does RNA signal recover. Scale bar = 5 μm. B) Quantification of FRAP of protein in N vs. pN condensates (n = 3 independent trials). C) Quantification of FRAP of RNA in N vs. pN condensates (n = 3 independent trials). D) Ensemble MSD versus lag time (prior to noise correction) for the protein and RNA combinations tested in this study. Inset: Representative trajectories from two-dimensional particle tracking showing Brownian motion of beads in N vs. pN condensates with 1–1000 RNA. Each tick represents 5 nm. E) Plot with the average viscous modulus (G’’, red) and the average elastic modulus (G’, blue) of N + 1–1000 RNA condensates as calculated from the MSDs (n ≥ 10 videos from 3 independent samples) after noise correction. F) The average viscous and elastic moduli after noise correction for pN + 1–1000 RNA condensates showing no crossover frequency in the range studied. G) The zero-shear viscosity of the protein and RNA condensates studied, calculated from the particle-tracking results after noise correction. Data from n ≥ 10 videos from 3 independent trials. H) Quantification of the timescales at which the elastic modulus dominates (color) versus the viscous modulus dominates (grey) in protein and RNA condensates. I) Viscosity of the protein and RNA condensates from micropipette aspiration. n = 3 independent trials. Error bars represent one standard deviation (±1 s.d.).

