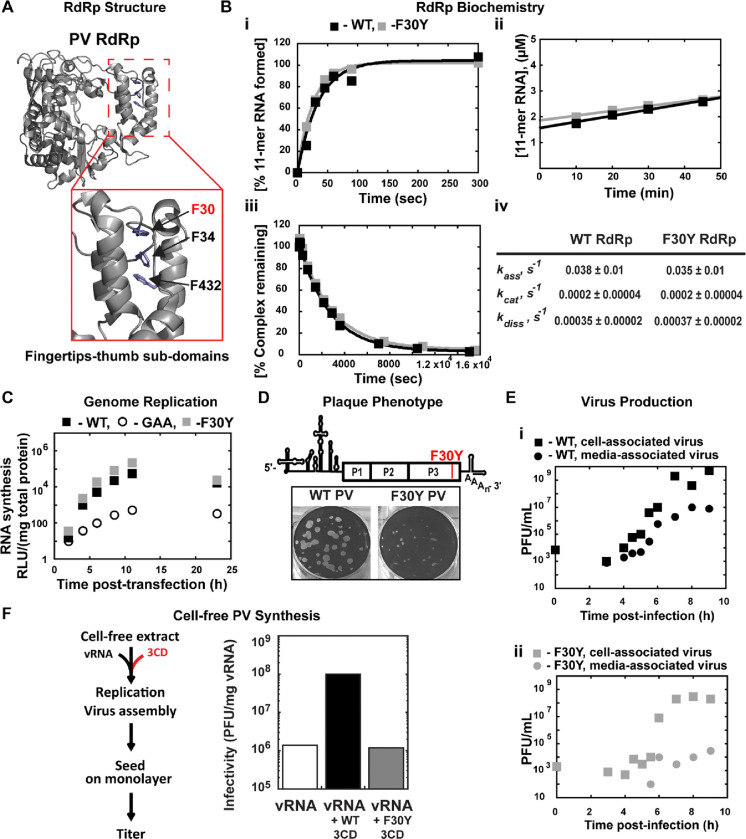
Figure 1. A post-genome-replication function for PV 3CD protein.
(A) PV 3D RdRp structure. The PV 3D RdRp structure is depicted as a gray ribbon; the structure adopts a canonical right-hand shape with fingers, palm, and thumb subdomains. The red box inset shows a close-up view of the fingertips-thumb subdomain interaction. Residues F30, F34 (fingertips), and F432 (thumb) are highlighted in blue to show the phenylalanine “stacking” interaction that occurs between the fingertips and thumb subdomains. The image was created using the WebLab Viewer (Molecular Simulations Ins., San Diego, CA) program (PDB access code 1RA6). (B) PV 3D F30Y biochemical properties. (i) Complex assembly kinetics. Shown are the kinetics of RNA product formation over time. Solid lines represent the best fit of the data to a single exponential with assembly rates (kass) of 0.038 ± 0.01 s-1 (WT) and 0.035 ± 0.01 s-1 (F30Y). (ii) Active site titration. Shown are the kinetics of RNA product formation over time. The data fit best to a straight line with y-intercepts representing concentrations of the active enzyme with 1.6 μM for WT and 1.8 μM for F30Y, corresponding to 80 and 90% of the total enzyme being “active,” respectively. The steady-state rate of AMP incorporation (kcat) was 0.0002 ± 0.00004 s-1 for both WT and F30Y. (iii) Complex dissociation kinetics. Shown are the kinetics of RdRp-primed-template complex dissociation over time. The solid lines represent the best fit of the data to a single exponential with dissociation rates (kdiss) of 0.00035 ± 0.00002 s-1 (WT) and 0.00037 ± 0.00002 s-1 (F30Y). (iv) WT and F30Y PV RdRp kinetic parameters. Table summarizing the kinetic parameters for WT and F30Y PV RdRp. (C) Genome replication. Sub-genomic replicon luciferase assay comparing WT and F30Y. Luciferase is measured as a surrogate for genome replication using a relative light unit (RLU) normalized to protein content (μg) from an absorbance measure of the collected lysates at the shown time points. In this assay, an inactive polymerase variant GAA PV controlled for translation and RNA stability during inhibited RNA synthesis. (D) Plaque Phenotype. A schematic PV genome schematic is shown, highlighting the F30Y mutation placement. Comparison of 50 PFU of WT and F30Y PV. The number of PFUs observed for WT and F30Y PV was essentially the same. However, the F30Y virus produced plaques of smaller size. (E) Virus Production. One-step growth curve comparing media-associated (supernatant) and cell-associated (cells) virus collected from WT and F30Y PV infections. Titers were quantified by plaque assay. (i) WT PV virus titers shown. (ii) F30Y PV virus titers shown. (F) Cell-free PV Synthesis. Schematic depicting the cell-free extract assay used to detect assembly stimulation in the context of exogenous viral protein supplementation. The graph shows the cell-free synthesis of PV in the presence of WT and F30Y purified 3CD. Titers were quantified by plaque assay and normalized to the amount of vRNA.

