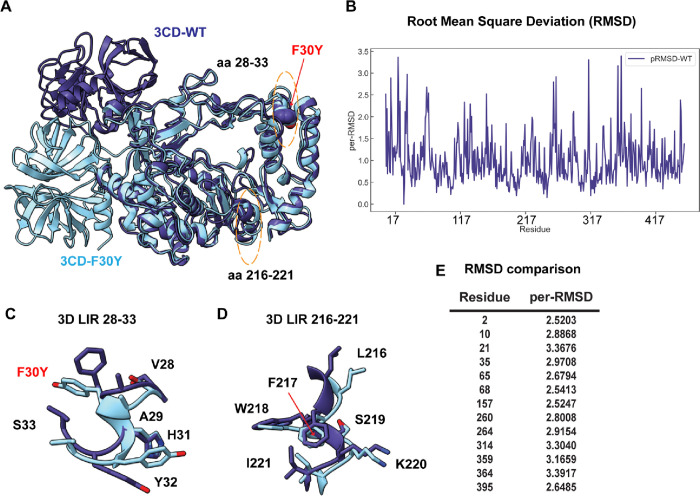
Figure 10. PV RdRp per-residue RMSD analysis suggests distinct conformational changes between WT and F30Y.
(A) MD-simulated WT and F30Y PV 3CD structures. Depicted are the most visited conformations of WT (dark slate blue) and F30Y (cyan) structures from MD simulations that are superimposed and shown as cartoons. The predicted 3D (28–33) LIR locations with the F30Y variant highlighted in red and (217–221) LIR are highlighted in dotted yellow ovals. (B) Root mean square deviation (RMSD). RMSD between the simulated WT and F30Y structures is plotted for the polymerase domain (aa 1–461, numbering corresponds to the 3D domain of 3CD). RMSD values were calculated using non-hydrogen atoms and averaged per-residue (per-RMSD). High per-residue RMSD values (>2.0) indicate regions of the polymerase that exhibited differences in conformations between WT and F30Y during MD simulations. (C) 3D LIR (28–33) F30Y conformational changes. Magnified view of the PV 3D (28–33) showing the distinct sidechain conformations of LIR residues 28–33. WT PV 3D is displayed in violet and F30Y in cyan. (D) 3D LIR (217–221) F30Y conformational changes. Magnified view of the PV 3D (217–221) showing the distinct sidechain conformations of LIR residues 217–221. WT PV 3D is displayed in violet F30Y in cyan. (E) RMSD comparison. Table describing highlighted values from the per-RMSD calculations between WT and F30Y PV 3CD with values higher than 2.0.

