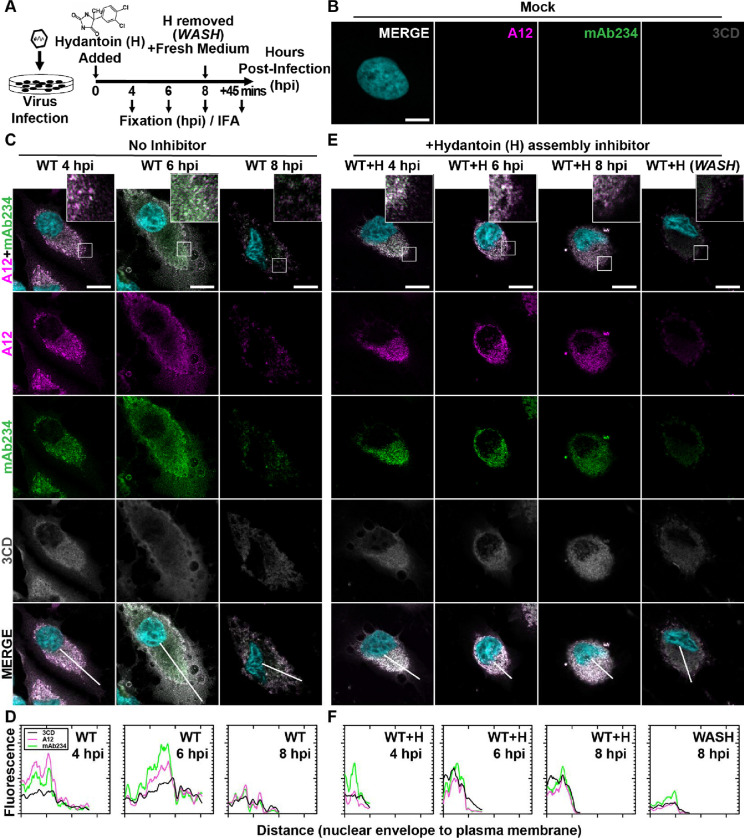
Figure 3. PV 3CD comigrates with virions from the perinuclear region of the cell to the periphery.
(A) PV time-course immunofluorescence assay (IFA) schematic. HeLa cell monolayer infections were carried out in the presence or absence of hydantoin. Infected cells were fixed at the stated time points (4-, 6-, or 8-) hours post-infection. An additional timepoint labeled “WASH” was collected for cells undergoing 8 hours of infection in the presence of hydantoin; the monolayer was then rinsed with PBS to remove the drug. After rinsing, fresh, warm, complete medium was added, and cells were incubated for 45 minutes before fixing. An immunostaining fluorescence assay (IFA) was then conducted on fixed cells. (B) Mock cell IFA. Representative confocal immunofluorescence images of mock HeLa cells showing no virus A12, mAb234, or 3CD protein reactivity in the absence of PV infection. Uninfected cells were fixed and immunostained 6 hours after initiating the experiment. Fixed cells were immunostained using A12 (magenta), mAb234 (green), and 3CD (grey) antibodies. The DAPI-stained nucleus is shown (cyan). Overlays of all four fluorescence signals (MERGE) are shown. (C) WT PV time-course IFA. Images illustrate representative confocal immunofluorescence fields of WT-infected HeLa cells 4-, 6- and 8- hours post-infection (hpi). HeLa cells were infected with WT PV at an MOI of 10, fixed, and immunostained at the labeled time points. Fixed cells were immunostained as described for mock cells in panel (B). The top panels show A12, mAb234, and DAPI fluorescence overlays with a perinuclear inset delineated with a white square. The bottom panels show A12, mAb234, 3CD, and DAPI fluorescence overlays (MERGE) with a white line extending from the nuclear envelope to the plasma membrane. Each column incrementally shows the hours post-infection from left to right 4-, 6-, and 8- hpi. (D) WT PV fluorescence intensity profiles. Intensity profile plots reveal the progression of A12, mAb234, and 3CD fluorescence over a WT PV infection time course. The bottom MERGE panels in (C) show a white line extending from the nuclear envelope to the plasma membrane used for “profile fluorescence” signal quantification. Intensity profile measurements were taken from regularly spaced points along a line segment to depict the spatial and temporal dynamics of fluorescence reactivity, levels, and signal overlap in infected cells over time. Values were plotted as a smooth line graph with relative fluorescence intensity units (RFU) on the Y-axis and distance (nm) on the X-axis. A12 (magenta), mAb234 (green), and 3CD (black) were plotted as independent lines in the graph. (E) WT PV time-course IFA in the presence of hydantoin. Images illustrate representative PV WT-infected HeLa cell confocal immunofluorescence fields in the presence of 50 μg/mL hydantoin (WT+H) 4-, 6-, and 8- hours post-infection (hpi) as described for WT in (C). An additional “WASH” time point indicates an infection where the hydantoin block is released at 8 hpi. (F) WT PV fluorescence intensity profiles in the presence of hydantoin. Intensity profile plots reveal the progression of A12, mAb234, and 3CD fluorescence over a WT PV infection time course in the hydantoin-inhibited state as described for WT in (D). Intensity measurements were acquired from the WT+H panels shown in (E).

