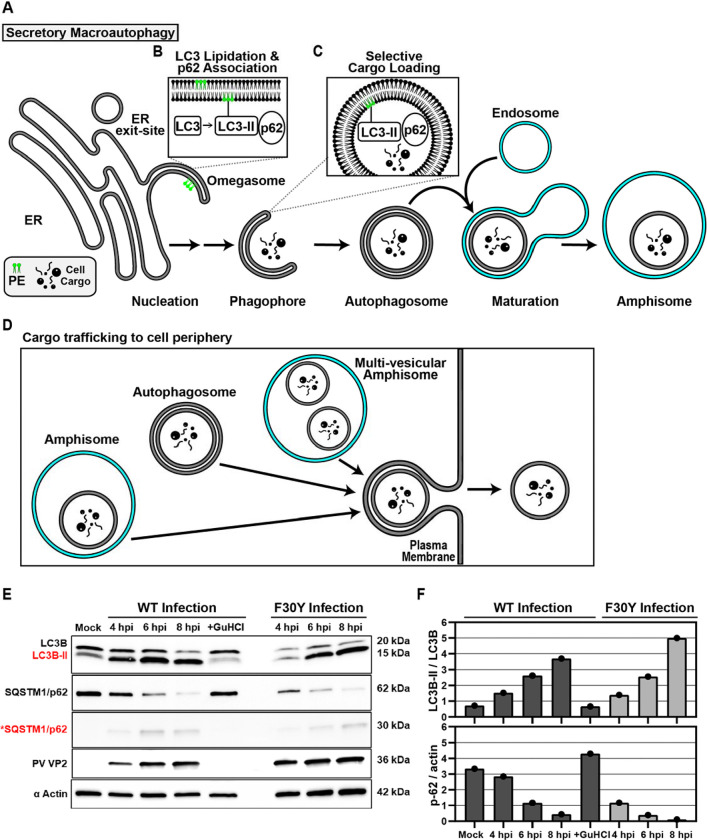
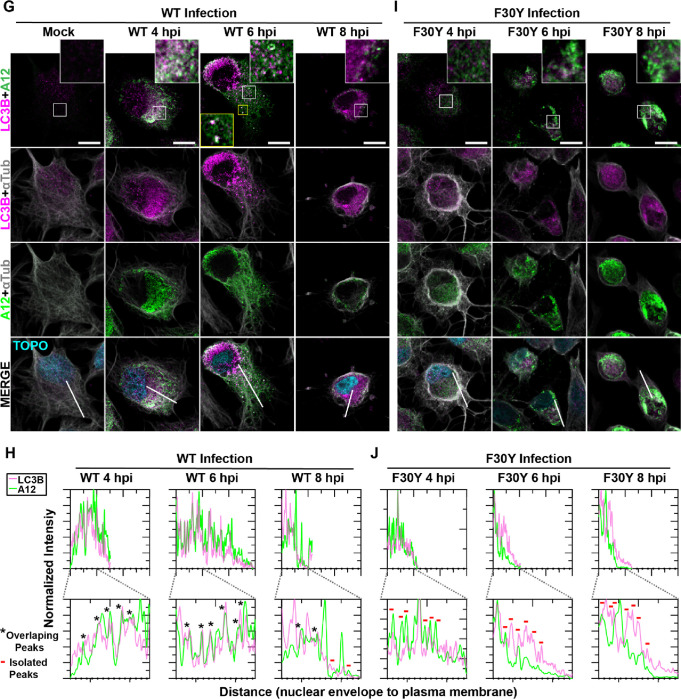
Figure 5. PV 3CD is required for colocalization of PV virions with lipidated LC3B.
(A) Autophagy pathway schematic. An ER-derived omegasome buds out and is engaged by multiple autophagy-associated proteins, adaptors, kinases, and protein complexes to yield an autophagophore in preparation for cargo loading and maturation of a double-membranous vesicle termed autophagosome. (B) Autophagosome maturation is triggered by the lipidated form of the essential microtubule-associated protein 1A/1B-light chain 3 (LC3) protein. (C) Cargo is recruited to the phagophore by combining factors, including LC3 and adaptor proteins like sequestosome (SQSTM1/p62), which promote selective cargo loading. For intact/functional cargo secretion in vesicles, the autophagosome may fuse with endosomes to form a cargo-containing amphisome. (D) Cargo-containing amphisomes, multi-vesicular amphisomes, and/or autophagosomes can then be trafficked to the plasma membrane and secreted onto the extracellular space. (E) WT and F30Y PV infection immunoblots. Images show representative immunoblots of WT and F30Y PV-infected cell lysates. Cells were infected with the indicated conditions, and lysates were collected at the displayed time points 4-, 6-, and 8- hours post-infection (hpi). Both mock and GuHCl control for infection and genome replication phenotypes, respectively. Lysates were then subject to western blot analysis and probed with LC3B, SQSTM1/p62, PV VP2, and α actin antibodies. (F) LC3B lipidation and SQSTM1/p62 cleavage quantification. WT and F30Y PV infection immunoblot quantification of LC3B and SQSTM1/p62 chemiluminescence signals. The ratio of lipidated- LC3B protein (LC3B-II) to LC3B protein increases while the full-length SQSTM1/p62 protein levels decrease as the infection progresses in WT and F30Y PV-infected HeLa cells. (G) WT PV time course – LC3B IFA. Images illustrate representative confocal immunofluorescence fields of WT-infected HeLa cells 4-, 6- and 8 hours post-infection (hpi). HeLa cells were infected with WT PV at an MOI of 10, fixed, and immunostained at the labeled time points. Fixed cells were immunostained using LC3B (magenta), A12 (green), and αTubulin (grey) antibodies. TOPO-stained nuclei are shown (cyan). The top panels show LC3B and A12 fluorescence overlay with a perinuclear inset delineated with a white square and a cytoplasmic inset in yellow. The bottom panels show LC3B, A12, αTubulin, and TOPO fluorescence overlays (MERGE) with a white line extending from the nuclear envelope to the plasma membrane of cells. Each column incrementally shows the hours post-infection from left to right mock, 4-, 6-, and 8- hpi. (H) WT PV fluorescence intensity profiles. Intensity profile plots reveal the progression of LC3B and A12 fluorescence in WT PV-infected cells over time. The bottom panels in (G) show LC3B, A12, αTubulin, and TOPO fluorescence overlays (MERGE), with a white line extending from the nuclear envelope to the plasma membrane used for “profile” fluorescence signal quantification. Intensity profile measurements were taken from regularly spaced points along a line segment to depict the spatial and temporal dynamics of fluorescence reactivity, levels, and signal overlap in infected cells over time. Values were plotted as a smooth line graph with relative fluorescence intensity units (RFU) on the Y-axis and distance (nm) on the X-axis. LC3B (magenta) and A12 (green). (I) F30Y PV time course – LC3B IFA. Images illustrate representative confocal immunofluorescence fields of F30Y PV-infected HeLa cells 4-, 6-, and 8 hours post-infection (hpi). Fixed cells were immunostained using LC3B (magenta), A12 (green), and αTubulin (grey) antibodies as described for WT PV in (G). TOPO-stained nuclei are shown (cyan). (J) F30Y PV fluorescence intensity profiles. Intensity profile plots reveal the progression of LC3B and A12 fluorescence of F30Y PV-infected cells over time. Intensity measurements were acquired from the panels shown in (I) as described for WT PV in (H).


